Candlestick Patterns and Signals
Interactive Video
•
Business
•
9th - 12th Grade
•
Practice Problem
•
Medium

Lucas Foster
Used 2+ times
FREE Resource
Read more
10 questions
Show all answers
1.
MULTIPLE CHOICE QUESTION
30 sec • 1 pt
What does a green candlestick typically indicate about a stock's price movement?
The price increased
The price decreased
The price remained the same
The price was volatile
2.
MULTIPLE CHOICE QUESTION
30 sec • 1 pt
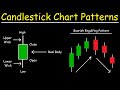
Which part of the candlestick represents the highest price of the day?
The open price
The lower wick
The upper wick
The real body
3.
MULTIPLE CHOICE QUESTION
30 sec • 1 pt
What does a large real body in a candlestick suggest?
Low trading volume
No price change
Stable prices
High momentum
4.
MULTIPLE CHOICE QUESTION
30 sec • 1 pt
In an uptrend, what does decreasing size of candlestick bodies indicate?
Stable momentum
Reversal of trend
Decreasing momentum
Increasing momentum
5.
MULTIPLE CHOICE QUESTION
30 sec • 1 pt
What is a key characteristic of the hanging man candlestick pattern?
It appears at the top of an uptrend
It has a long lower wick
It has a long upper wick
It appears at the bottom of a downtrend
6.
MULTIPLE CHOICE QUESTION
30 sec • 1 pt
What does the hammer candlestick pattern indicate?
Continuation of a trend
Reversal from a downtrend to an uptrend
Reversal from an uptrend to a downtrend
No significant change
7.
MULTIPLE CHOICE QUESTION
30 sec • 1 pt
What does the absence of an upper wick in a hammer candlestick suggest?
The high and close are the same
The open and close are the same
The low and open are the same
The high and low are the same
Access all questions and much more by creating a free account
Create resources
Host any resource
Get auto-graded reports
Continue with Google

Continue with Email
Continue with Classlink
Continue with Clever
or continue with
Microsoft
%20(1).png)
Apple
Others
Already have an account?
