Understanding Normal Distribution and Z-Scores
Interactive Video
•
Mathematics
•
9th - 12th Grade
•
Practice Problem
•
Hard
Standards-aligned

Aiden Montgomery
FREE Resource
Standards-aligned
Read more
10 questions
Show all answers
1.
MULTIPLE CHOICE QUESTION
30 sec • 1 pt
What is the mean wait time for drive-thru restaurants in the town?
185 seconds
205 seconds
195 seconds
175 seconds
2.
MULTIPLE CHOICE QUESTION
30 sec • 1 pt
What is the standard deviation of the wait times in the town?
9 seconds
11 seconds
12 seconds
10 seconds
3.
MULTIPLE CHOICE QUESTION
30 sec • 1 pt
What does a normal distribution imply about the data?
Data is skewed to the left
Data is evenly distributed around the mean
Data is skewed to the right
Data has multiple peaks
Tags
CCSS.HSS.ID.A.4
4.
MULTIPLE CHOICE QUESTION
30 sec • 1 pt
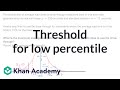
What is the significance of the dotted lines in the normal distribution visualization?
They represent the mean
They represent standard deviations from the mean
They represent the mode
They represent the median
5.
MULTIPLE CHOICE QUESTION
30 sec • 1 pt
What is the purpose of finding a z-score in this context?
To calculate the mean
To identify the maximum wait time for the bottom 10%
To determine the standard deviation
To find the average wait time
6.
MULTIPLE CHOICE QUESTION
30 sec • 1 pt
What does a z-score of -1.29 indicate?
The wait time is exactly at the mean
The wait time is above the mean
The wait time is below the mean
The wait time is in the top 10%
Tags
CCSS.HSS.ID.A.4
7.
MULTIPLE CHOICE QUESTION
30 sec • 1 pt
How do you calculate the actual wait time using the z-score?
Add the z-score to the mean
Subtract the z-score from the mean
Multiply the z-score by the standard deviation and subtract from the mean
Multiply the z-score by the standard deviation and add to the mean
Access all questions and much more by creating a free account
Create resources
Host any resource
Get auto-graded reports
Continue with Google

Continue with Email
Continue with Classlink
Continue with Clever
or continue with
Microsoft
%20(1).png)
Apple
Others
Already have an account?
