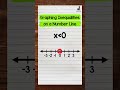
Graphing Inequalities on a Number Line
Interactive Video
•
Mathematics
•
5th - 8th Grade
•
Practice Problem
•
Hard
Standards-aligned

Emma Peterson
FREE Resource
Standards-aligned
Read more
5 questions
Show all answers
1.
MULTIPLE CHOICE QUESTION
30 sec • 1 pt
What does the inequality X < 0 mean in terms of number line representation?
X is not a number
X is less than zero
X is equal to zero
X is greater than zero
Tags
CCSS.6.EE.B.8
2.
MULTIPLE CHOICE QUESTION
30 sec • 1 pt
Why is an open circle used at zero when graphing X < 0?
Zero is included in the solution
Zero is greater than X
Zero is not included in the solution
Zero is the only solution
Tags
CCSS.6.EE.B.8
3.
MULTIPLE CHOICE QUESTION
30 sec • 1 pt
What does the open circle on a number line indicate?
The number is not included in the solution
The number is greater than all solutions
The number is included in the solution
The number is the only solution
Tags
CCSS.6.EE.B.8
4.
MULTIPLE CHOICE QUESTION
30 sec • 1 pt
In which direction should the arrow point when graphing X < 0?
To the right
To the left
Upwards
Downwards
Tags
CCSS.6.EE.B.8
5.
MULTIPLE CHOICE QUESTION
30 sec • 1 pt
What does the arrow on the number line represent in the context of X < 0?
All numbers less than zero
All numbers greater than or equal to zero
All numbers equal to zero
All numbers greater than zero
Tags
CCSS.6.EE.B.8
Access all questions and much more by creating a free account
Create resources
Host any resource
Get auto-graded reports
Continue with Google

Continue with Email
Continue with Classlink
Continue with Clever
or continue with
Microsoft
%20(1).png)
Apple
Others
Already have an account?
