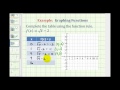
Understanding Function Graphs
Interactive Video
•
Mathematics
•
6th - 9th Grade
•
Practice Problem
•
Hard
+3
Standards-aligned

Mia Campbell
FREE Resource
Standards-aligned
Read more
10 questions
Show all answers
1.
MULTIPLE CHOICE QUESTION
30 sec • 1 pt
What is the function rule used in this lesson?
f(x) = x - 2
f(x) = sqrt(x) - 2
f(x) = x^2 + 2
f(x) = 2x + 1
Tags
CCSS.8.F.A.1
CCSS.HSF.IF.B.5
2.
MULTIPLE CHOICE QUESTION
30 sec • 1 pt
Why can't X be negative in this function?
It would result in a negative Y value.
It would make the function undefined.
It would produce an imaginary number.
It would make the graph a straight line.
Tags
CCSS.HSA-REI.B.4B
3.
MULTIPLE CHOICE QUESTION
30 sec • 1 pt
Which of the following is a perfect square that can be used for X?
5
9
3
8
Tags
CCSS.HSF-IF.C.7B
4.
MULTIPLE CHOICE QUESTION
30 sec • 1 pt
Why is it easier to select perfect squares for X?
They make the graph linear.
They simplify the calculation of Y values.
They are the only values allowed.
They make the graph symmetrical.
Tags
CCSS.6.EE.C.9
5.
MULTIPLE CHOICE QUESTION
30 sec • 1 pt
What is the Y value when X is 0?
2
1
0
-2
Tags
CCSS.8.F.A.1
CCSS.HSF.IF.B.5
6.
MULTIPLE CHOICE QUESTION
30 sec • 1 pt
What point is plotted on the graph when X is 4?
(4, 0)
(4, -2)
(4, 2)
(4, 1)
7.
MULTIPLE CHOICE QUESTION
30 sec • 1 pt
Which point represents the X-intercept on the graph?
(4, 0)
(1, -1)
(0, -2)
(9, 1)
Access all questions and much more by creating a free account
Create resources
Host any resource
Get auto-graded reports
Continue with Google

Continue with Email
Continue with Classlink
Continue with Clever
or continue with
Microsoft
%20(1).png)
Apple
Others
Already have an account?
Popular Resources on Wayground

7 questions
History of Valentine's Day
Interactive video
•
4th Grade
15 questions
Fractions on a Number Line
Quiz
•
3rd Grade
20 questions
Equivalent Fractions
Quiz
•
3rd Grade
25 questions
Multiplication Facts
Quiz
•
5th Grade
22 questions
fractions
Quiz
•
3rd Grade
15 questions
Valentine's Day Trivia
Quiz
•
3rd Grade
20 questions
Main Idea and Details
Quiz
•
5th Grade
20 questions
Context Clues
Quiz
•
6th Grade
Discover more resources for Mathematics
20 questions
Writing Algebraic Expressions
Quiz
•
6th Grade
20 questions
Ratios/Rates and Unit Rates
Quiz
•
6th Grade
14 questions
Volume of rectangular prisms
Quiz
•
7th Grade
20 questions
Laws of Exponents
Quiz
•
8th Grade
20 questions
Graphing Inequalities on a Number Line
Quiz
•
6th - 9th Grade
20 questions
One Step Equations
Quiz
•
6th Grade
20 questions
Exponent Properties
Quiz
•
9th Grade
10 questions
Solving One Step Inequalities
Quiz
•
6th Grade