Understanding Graphs and Ordered Pairs
Interactive Video
•
Mathematics, Science, Geography
•
5th - 8th Grade
•
Practice Problem
•
Hard

Jackson Turner
FREE Resource
Read more
10 questions
Show all answers
1.
MULTIPLE CHOICE QUESTION
30 sec • 1 pt
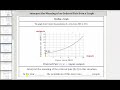
What does the graph in the video represent?
The educational development of a town from 2003 to 2013
The economic growth of a town from 2003 to 2013
The population growth of a town from 2003 to 2013
The weather patterns of a town from 2003 to 2013
2.
MULTIPLE CHOICE QUESTION
30 sec • 1 pt
In a graph, where are the input values typically located?
Along the vertical axis
Along the horizontal axis
In the center of the graph
Outside the graph
3.
MULTIPLE CHOICE QUESTION
30 sec • 1 pt
What does the ordered pair (0, 2) signify in the context of the graph?
In 2003, the population was 2000
In 2003, the population was 20,000
In 2003, the population was 200
In 2003, the population was 2
4.
MULTIPLE CHOICE QUESTION
30 sec • 1 pt
How do you find the output value for an ordered pair on a graph?
By looking at the center of the graph
By looking at the diagonal axis
By looking at the vertical axis
By looking at the horizontal axis
5.
MULTIPLE CHOICE QUESTION
30 sec • 1 pt
What year does the input value '7' correspond to in the graph?
2003
2013
2010
2007
6.
MULTIPLE CHOICE QUESTION
30 sec • 1 pt
What does the ordered pair (7, 8) indicate about the town's population?
In 2010, the population was 8,000
In 2010, the population was 800
In 2010, the population was 800,000
In 2010, the population was 80,000
7.
MULTIPLE CHOICE QUESTION
30 sec • 1 pt
What is the significance of the vertical axis in the graph?
It represents the years since 2003
It represents the population in thousands
It represents the economic growth
It represents the weather patterns
Access all questions and much more by creating a free account
Create resources
Host any resource
Get auto-graded reports
Continue with Google

Continue with Email
Continue with Classlink
Continue with Clever
or continue with
Microsoft
%20(1).png)
Apple
Others
Already have an account?
Popular Resources on Wayground

15 questions
Fractions on a Number Line
Quiz
•
3rd Grade
20 questions
Equivalent Fractions
Quiz
•
3rd Grade
25 questions
Multiplication Facts
Quiz
•
5th Grade
29 questions
Alg. 1 Section 5.1 Coordinate Plane
Quiz
•
9th Grade
22 questions
fractions
Quiz
•
3rd Grade
11 questions
FOREST Effective communication
Lesson
•
KG
20 questions
Main Idea and Details
Quiz
•
5th Grade
20 questions
Context Clues
Quiz
•
6th Grade
Discover more resources for Mathematics
25 questions
Multiplication Facts
Quiz
•
5th Grade
36 questions
6th Grade Math STAAR Review
Quiz
•
6th Grade
15 questions
Rounding Decimals
Quiz
•
5th Grade
14 questions
Volume of rectangular prisms
Quiz
•
7th Grade
14 questions
finding slope from a graph
Quiz
•
8th Grade
20 questions
Graphing Inequalities on a Number Line
Quiz
•
6th - 9th Grade
23 questions
Solve and Graph Inequalities
Quiz
•
6th Grade
16 questions
Volume of Rectangular Prisms and Cubes
Quiz
•
5th Grade