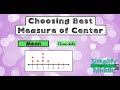
Measures of Center in Data Analysis
Interactive Video
•
Mathematics, English, Science, Education
•
5th - 8th Grade
•
Practice Problem
•
Medium

Emma Peterson
Used 17+ times
FREE Resource
Read more
10 questions
Show all answers
1.
MULTIPLE CHOICE QUESTION
30 sec • 1 pt
What are the three measures of center discussed in the lesson?
Mean, Median, Mode
Mode, Range, Median
Median, Range, Mean
Mean, Range, Mode
2.
MULTIPLE CHOICE QUESTION
30 sec • 1 pt
When is it most appropriate to use the mean as a measure of center?
When data is categorical
When data points repeat
When data points are close together
When data points are far apart
3.
MULTIPLE CHOICE QUESTION
30 sec • 1 pt
Why might the median be a better measure of center than the mean in some cases?
It is always more accurate
It is easier to calculate
It is less affected by outliers
It is used for categorical data
4.
MULTIPLE CHOICE QUESTION
30 sec • 1 pt
In which scenario would you use the median to represent your data?
When data points repeat
When data is categorical
When there is an outlier
When data points are close together
5.
MULTIPLE CHOICE QUESTION
30 sec • 1 pt
What is the mode used for in data analysis?
To find the middle value
To find the range
To find the average
To find the most frequent value
6.
MULTIPLE CHOICE QUESTION
30 sec • 1 pt
When is mode particularly useful?
When data points are close together
When data is categorical
When there is an outlier
When data points are far apart
7.
MULTIPLE CHOICE QUESTION
30 sec • 1 pt
Which measure of center is best for categorical data?
Mean
Median
Mode
Range
Access all questions and much more by creating a free account
Create resources
Host any resource
Get auto-graded reports
Continue with Google

Continue with Email
Continue with Classlink
Continue with Clever
or continue with
Microsoft
%20(1).png)
Apple
Others
Already have an account?
