Exploring Box and Whisker Plots
Interactive Video
•
Mathematics
•
6th - 10th Grade
•
Practice Problem
•
Hard
Standards-aligned

Liam Anderson
Used 3+ times
FREE Resource
Standards-aligned
10 questions
Show all answers
1.
MULTIPLE CHOICE QUESTION
30 sec • 1 pt
What is the smallest value in a dataset called?
Median
Maximum
First Quartile
Minimum
Tags
CCSS.6.SP.B.4
CCSS.HSS.ID.A.1
2.
MULTIPLE CHOICE QUESTION
30 sec • 1 pt
Which value represents the middle of a dataset?
Third Quartile
Minimum
Median
Maximum
Tags
CCSS.6.SP.B.5C
3.
MULTIPLE CHOICE QUESTION
30 sec • 1 pt
How is the first quartile (Q1) found in an even set of data?
Average of two middle numbers
Middle number of the lower half
Middle number of the upper half
Smallest number
Tags
CCSS.6.SP.B.5C
4.
MULTIPLE CHOICE QUESTION
30 sec • 1 pt
What does the third quartile (Q3) represent?
100th percentile
75th percentile
50th percentile
25th percentile
Tags
CCSS.6.SP.B.5C
5.
MULTIPLE CHOICE QUESTION
30 sec • 1 pt
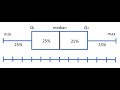
In a box plot, what do the whiskers represent?
None of the above
Median and Mean
Q1 and Q3
Minimum and Maximum
Tags
CCSS.6.SP.B.4
CCSS.HSS.ID.A.1
6.
MULTIPLE CHOICE QUESTION
30 sec • 1 pt
What is the range of the middle 50% of data in a box plot known as?
Range
Mean
Interquartile Range (IQR)
Standard Deviation
Tags
CCSS.6.SP.B.5C
7.
MULTIPLE CHOICE QUESTION
30 sec • 1 pt
Which quartile is represented by the 25th percentile?
Third Quartile (Q3)
Median
First Quartile (Q1)
Maximum
Tags
CCSS.6.SP.B.5C
Access all questions and much more by creating a free account
Create resources
Host any resource
Get auto-graded reports
Continue with Google

Continue with Email
Continue with Classlink
Continue with Clever
or continue with
Microsoft
%20(1).png)
Apple
Others
Already have an account?
