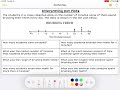
Interpreting Dot Plots Effectively
Interactive Video
•
Mathematics
•
6th - 10th Grade
•
Practice Problem
•
Hard
+4
Standards-aligned

Lucas Foster
FREE Resource
Standards-aligned
Read more
10 questions
Show all answers
1.
MULTIPLE CHOICE QUESTION
30 sec • 1 pt
How many students participated in the survey?
7 students
9 students
8 students
10 students
Tags
CCSS.6.SP.B.5A
2.
MULTIPLE CHOICE QUESTION
30 sec • 1 pt
What is the median brushing time among the students?
3 minutes
3.5 minutes
3.75 minutes
4 minutes
Tags
CCSS.6.SP.B.5C
3.
MULTIPLE CHOICE QUESTION
30 sec • 1 pt
What is the median value when two middle values are present?
The lower value
Sum of the two values
The higher value
Average of the two values
Tags
CCSS.6.SP.B.5C
4.
MULTIPLE CHOICE QUESTION
30 sec • 1 pt
How is the range of brushing times calculated?
Sum of all times
Average of all times
Maximum time plus minimum time
Maximum time minus minimum time
Tags
CCSS.6.SP.B.4
CCSS.HSS.ID.A.1
5.
MULTIPLE CHOICE QUESTION
30 sec • 1 pt
What is the range of brushing times?
2.5 minutes
4 minutes
3 minutes
3.5 minutes
Tags
CCSS.2.MD.B.5
6.
MULTIPLE CHOICE QUESTION
30 sec • 1 pt
How many students brushed their teeth for more than three minutes?
6 students
5 students
7 students
4 students
Tags
CCSS.2.MD.D.9
CCSS.3.MD.B.4
7.
MULTIPLE CHOICE QUESTION
30 sec • 1 pt
How many students brushed their teeth exactly for four minutes?
3 students
5 students
2 students
4 students
Tags
CCSS.2.MD.D.9
CCSS.3.MD.B.4
Access all questions and much more by creating a free account
Create resources
Host any resource
Get auto-graded reports
Continue with Google

Continue with Email
Continue with Classlink
Continue with Clever
or continue with
Microsoft
%20(1).png)
Apple
Others
Already have an account?
Similar Resources on Wayground

11 questions
Adding and Subtracting Numbers in Scientific Notation
Interactive video
•
6th - 10th Grade
11 questions
Crafting the Experimental Design FRQ for AP Environmental Science
Interactive video
•
6th - 10th Grade
11 questions
Exploring Science Tools for Students
Interactive video
•
6th - 10th Grade
Popular Resources on Wayground
15 questions
Fractions on a Number Line
Quiz
•
3rd Grade
20 questions
Equivalent Fractions
Quiz
•
3rd Grade
25 questions
Multiplication Facts
Quiz
•
5th Grade
54 questions
Analyzing Line Graphs & Tables
Quiz
•
4th Grade
22 questions
fractions
Quiz
•
3rd Grade
20 questions
Main Idea and Details
Quiz
•
5th Grade
20 questions
Context Clues
Quiz
•
6th Grade
15 questions
Equivalent Fractions
Quiz
•
4th Grade
Discover more resources for Mathematics
22 questions
distributive property
Quiz
•
7th Grade
18 questions
Angle Relationships
Quiz
•
7th Grade
15 questions
Distributive Property & Review
Quiz
•
6th Grade
20 questions
Writing Algebraic Expressions
Quiz
•
6th Grade
20 questions
How Some Friendships Last — and Others Don’t Video Questions
Quiz
•
7th Grade
14 questions
finding slope from a graph
Quiz
•
8th Grade
20 questions
Ratios/Rates and Unit Rates
Quiz
•
6th Grade
18 questions
Handbook Refresher Quiz
Quiz
•
7th Grade