- Resource Library
- Math
- Data And Graphing
- Data Representation
- Data Representation Skills For 3rd Grade Staar
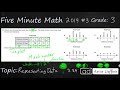
Data Representation Skills for 3rd Grade STAAR
Interactive Video
•
Mathematics
•
1st - 5th Grade
•
Practice Problem
•
Hard
+7
Standards-aligned

Amelia Wright
FREE Resource
Standards-aligned
10 questions
Show all answers
1.
MULTIPLE CHOICE QUESTION
30 sec • 1 pt
What grade level is the math concept of representing data discussed in the video?
Fifth Grade
Fourth Grade
Third Grade
Second Grade
2.
MULTIPLE CHOICE QUESTION
30 sec • 1 pt
What standard does the data representation concept belong to in Texas?
3.8 a
3.8 b
4.8 b
4.8 a
3.
MULTIPLE CHOICE QUESTION
30 sec • 1 pt
How many days did Alberto run according to the data table?
18 days
17 days
16 days
15 days
Tags
CCSS.6.SP.B.5A
4.
MULTIPLE CHOICE QUESTION
30 sec • 1 pt
What is the purpose of converting tally marks to digits in the data table?
To create errors
To simplify calculation
To confuse the reader
To increase data size
Tags
CCSS.1.MD.C.4
5.
MULTIPLE CHOICE QUESTION
30 sec • 1 pt
What is a mixed number in the context of the dot plot?
A number combining a whole number and a fraction
A whole number
A negative number
A number with decimals
Tags
CCSS.3.NF.A.1
CCSS.3.NF.A.2B
6.
MULTIPLE CHOICE QUESTION
30 sec • 1 pt
Where is 'one and a half' placed on the dot plot?
Between 3 and 4
Between 2 and 3
Between 1 and 2
Between 0 and 1
Tags
CCSS.4.MD.B.4
7.
MULTIPLE CHOICE QUESTION
30 sec • 1 pt
Which dot plot option correctly represents the data for 'one and a half miles'?
Option D
Option C
Option B
Option A
Tags
CCSS.3.MD.B.4
Access all questions and much more by creating a free account
Create resources
Host any resource
Get auto-graded reports
Continue with Google

Continue with Email
Continue with Classlink
Continue with Clever
or continue with
Microsoft
%20(1).png)
Apple
Others
Already have an account?
