Graphing Linear Equations Using Tables of Values
Interactive Video
•
Mathematics
•
9th - 12th Grade
•
Practice Problem
•
Medium
Standards-aligned

Amelia Wright
Used 8+ times
FREE Resource
Standards-aligned
Read more
10 questions
Show all answers
1.
MULTIPLE CHOICE QUESTION
30 sec • 1 pt
What is the y-value when x is 0 for the equation y = x + 1?
2
1
0
-1
Tags
CCSS.6.EE.C.9
2.
MULTIPLE CHOICE QUESTION
30 sec • 1 pt
What ordered pair represents x = 2 in the equation y = x + 1?
(1, 2)
(2, 3)
(2, 4)
(3, 2)
3.
MULTIPLE CHOICE QUESTION
30 sec • 1 pt
What is the y-value when x = -1 for the equation y = -2x + 1?
3
-3
-1
1
Tags
CCSS.HSF.IF.A.2
4.
MULTIPLE CHOICE QUESTION
30 sec • 1 pt
How many points are sufficient to plot a straight line?
Five
Four
Three
Two
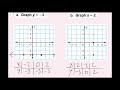
5.
MULTIPLE CHOICE QUESTION
30 sec • 1 pt
What type of line does the equation y = -3 represent?
Curved line
Diagonal line
Vertical line
Horizontal line
6.
MULTIPLE CHOICE QUESTION
30 sec • 1 pt
Which point does NOT lie on the line x = 2?
(2, -3)
(3, 2)
(2, 0)
(2, 2)
7.
MULTIPLE CHOICE QUESTION
30 sec • 1 pt
At what wind speed does a tropical storm become a hurricane?
74 mph
68 mph
72 mph
66 mph
Access all questions and much more by creating a free account
Create resources
Host any resource
Get auto-graded reports
Continue with Google

Continue with Email
Continue with Classlink
Continue with Clever
or continue with
Microsoft
%20(1).png)
Apple
Others
Already have an account?
