Exploring Box and Whisker Plots
Interactive Video
•
Mathematics
•
9th - 12th Grade
•
Practice Problem
•
Hard
Standards-aligned

Mia Campbell
FREE Resource
Standards-aligned
Read more
10 questions
Show all answers
1.
MULTIPLE CHOICE QUESTION
30 sec • 1 pt
What is the second quartile also known as?
Range
Mode
Median
Mean
Tags
CCSS.6.SP.B.5C
2.
MULTIPLE CHOICE QUESTION
30 sec • 1 pt
How many parts does a quartile divide the data into?
Four
Eight
Six
Two
Tags
CCSS.6.SP.B.5C
3.
MULTIPLE CHOICE QUESTION
30 sec • 1 pt
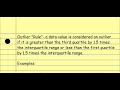
What is the first quartile value in the example discussed?
2
21
11
5
Tags
CCSS.6.SP.B.5C
4.
MULTIPLE CHOICE QUESTION
30 sec • 1 pt
What does the interquartile range represent?
Average value of the data set
Sum of all quartiles
Difference between the first and third quartiles
Difference between the maximum and minimum values
Tags
CCSS.6.SP.B.5C
5.
MULTIPLE CHOICE QUESTION
30 sec • 1 pt
In a box-and-whisker plot, what do the 'whiskers' represent?
Maximum and Minimum values
First and Third Quartiles
Median and Mode
None of the above
Tags
CCSS.6.SP.B.4
CCSS.HSS.ID.A.1
6.
MULTIPLE CHOICE QUESTION
30 sec • 1 pt
What is the interquartile range if the first quartile is 5 and the third quartile is 21?
16
21
15
26
Tags
CCSS.6.SP.B.5C
7.
MULTIPLE CHOICE QUESTION
30 sec • 1 pt
How is an outlier determined in relation to the interquartile range?
Less than the first quartile minus 1.5 times the interquartile range
Greater than the third quartile plus 1.5 times the interquartile range
Neither A nor B
Both A and B
Access all questions and much more by creating a free account
Create resources
Host any resource
Get auto-graded reports
Continue with Google

Continue with Email
Continue with Classlink
Continue with Clever
or continue with
Microsoft
%20(1).png)
Apple
Others
Already have an account?
