Exploring Histograms and Box Plots
Interactive Video
•
Mathematics
•
6th - 8th Grade
•
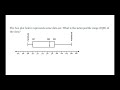
Practice Problem
•
Hard
+2
Standards-aligned

Ethan Morris
FREE Resource
Standards-aligned
Read more
10 questions
Show all answers
1.
MULTIPLE CHOICE QUESTION
30 sec • 1 pt
What is the mean of the given dataset?
14.4
28
30
7
Tags
CCSS.6.SP.B.5C
2.
MULTIPLE CHOICE QUESTION
30 sec • 1 pt
Which value is the mode of the dataset?
14.4
30
28
7
Tags
CCSS.6.SP.B.5C
3.
MULTIPLE CHOICE QUESTION
30 sec • 1 pt
What number represents the median of the dataset?
28
7
30
14.4
Tags
CCSS.6.SP.B.5C
4.
MULTIPLE CHOICE QUESTION
30 sec • 1 pt
Calculate the range of the dataset.
14.4
28
30
7
Tags
CCSS.6.SP.B.4
CCSS.HSS.ID.A.1
5.
MULTIPLE CHOICE QUESTION
30 sec • 1 pt
Identify the type of graph that groups data and helps identify the mode.
Box plot
Scatter plot
Frequency graph
Dot plot
6.
MULTIPLE CHOICE QUESTION
30 sec • 1 pt
How many students participated in the test according to the frequency graph?
25
30
20
15
Tags
CCSS.6.SP.B.5A
7.
MULTIPLE CHOICE QUESTION
30 sec • 1 pt
How many pumpkins have a mass greater than 6 kilograms?
20
22
18
16
Tags
CCSS.3.MD.B.4
Access all questions and much more by creating a free account
Create resources
Host any resource
Get auto-graded reports
Continue with Google

Continue with Email
Continue with Classlink
Continue with Clever
or continue with
Microsoft
%20(1).png)
Apple
Others
Already have an account?
