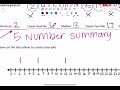
Exploring Box and Whisker Plots
Interactive Video
•
Mathematics
•
6th - 8th Grade
•
Practice Problem
•
Medium
Standards-aligned

Ethan Morris
Used 3+ times
FREE Resource
Standards-aligned
10 questions
Show all answers
1.
MULTIPLE CHOICE QUESTION
30 sec • 1 pt
What is the primary purpose of a box and whisker plot?
To represent data in time series
To summarize data distribution
To display every individual data point
To calculate data averages
Tags
CCSS.6.SP.B.4
CCSS.HSS.ID.A.1
2.
MULTIPLE CHOICE QUESTION
30 sec • 1 pt
Which of the following is NOT one of the five key numbers in a box plot?
Minimum
Upper Quartile
Mean
Median
Tags
CCSS.6.SP.B.4
CCSS.HSS.ID.A.1
3.
MULTIPLE CHOICE QUESTION
30 sec • 1 pt
What does the upper quartile represent in a box plot?
The maximum data value
The median of the upper half of the data
The median of the lower half of the data
The average value of the dataset
Tags
CCSS.6.SP.B.4
CCSS.HSS.ID.A.1
4.
MULTIPLE CHOICE QUESTION
30 sec • 1 pt
How is the inner quartile range calculated?
Average of upper and lower quartiles
Maximum minus minimum
Median of all data points
Upper quartile minus lower quartile
Tags
CCSS.6.SP.B.5C
5.
MULTIPLE CHOICE QUESTION
30 sec • 1 pt
Which line in a box plot typically represents the median?
The first vertical line
The second vertical line
The middle line of the box
The last vertical line
Tags
CCSS.6.SP.B.4
CCSS.HSS.ID.A.1
6.
MULTIPLE CHOICE QUESTION
30 sec • 1 pt
In constructing a box plot, what is the first step?
Drawing the whiskers
Calculating the median
Identifying outliers
Ordering the data from least to greatest
Tags
CCSS.6.SP.B.4
CCSS.HSS.ID.A.1
7.
MULTIPLE CHOICE QUESTION
30 sec • 1 pt
How do you find the lower quartile in a dataset?
It's the smallest data value
It's the average of all data points
It's the value just below the dataset's median
It's the median of the lower half of the data
Tags
CCSS.6.SP.B.5C
Access all questions and much more by creating a free account
Create resources
Host any resource
Get auto-graded reports
Continue with Google

Continue with Email
Continue with Classlink
Continue with Clever
or continue with
Microsoft
%20(1).png)
Apple
Others
Already have an account?
