Exploring 7th Grade Math Concepts from the 2018 STAAR Test
Interactive Video
•
Mathematics
•
6th - 10th Grade
•
Practice Problem
•
Hard
+6
Standards-aligned

Lucas Foster
Used 1+ times
FREE Resource
Standards-aligned
Read more
10 questions
Show all answers
1.
MULTIPLE CHOICE QUESTION
30 sec • 1 pt
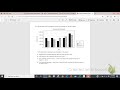
What does an increment of 100,000 units on the graph indicate?
Each bar on the graph represents 100,000 in sales.
The total expenses over five years are 100,000.
The company's income increases by 100,000 every year.
Each step on the graph's axis increases by 100,000.
Tags
CCSS.6.SP.B.4
CCSS.HSS.ID.A.1
2.
MULTIPLE CHOICE QUESTION
30 sec • 1 pt
What does the combined expenses and income comparison over years three and four reveal?
Expenses were lower than income in both years.
Expenses were $300,000 more than income.
The company broke even in years three and four.
Income exceeded expenses by $300,000.
Tags
CCSS.8.F.A.2
CCSS.HSF.IF.C.9
3.
MULTIPLE CHOICE QUESTION
30 sec • 1 pt
How do you calculate the height of the scale model of a sports stadium?
By adding 30 feet for every 2 inches in the model.
Using a proportion based on the scale given.
Dividing the actual height by 2.
Multiplying the actual height by the scale factor.
Tags
CCSS.7.RP.A.2C
4.
MULTIPLE CHOICE QUESTION
30 sec • 1 pt
What does the inequality 120 ≤ 12K + 29 represent in real life?
The maximum number of buttons Felicia can collect.
The minimum number of years Felicia needs to collect 120 buttons.
The total number of buttons collected over K years.
The number of buttons Felicia starts with.
Tags
CCSS.7.EE.B.4B
5.
MULTIPLE CHOICE QUESTION
30 sec • 1 pt
How do you find the area of the shaded region in a figure?
By subtracting the area of the square from the area of the circle.
Adding the areas of the square and circle.
Multiplying the area of the square by the area of the circle.
Dividing the area of the circle by the area of the square.
Tags
CCSS.3.MD.C.7D
6.
MULTIPLE CHOICE QUESTION
30 sec • 1 pt
What does the box plot comparison reveal about the songs' lengths?
Player X has a wider range of song lengths than Player Y.
The maximum length of songs is the same for both players.
Player Y's songs have a smaller interquartile range than Player X.
The median song length is greater for Player X.
Tags
CCSS.6.SP.B.4
CCSS.HSS.ID.A.1
7.
MULTIPLE CHOICE QUESTION
30 sec • 1 pt
Which set includes both whole numbers and their negative counterparts?
Whole numbers
Integers
Rational numbers
Natural numbers
Access all questions and much more by creating a free account
Create resources
Host any resource
Get auto-graded reports
Continue with Google

Continue with Email
Continue with Classlink
Continue with Clever
or continue with
Microsoft
%20(1).png)
Apple
Others
Already have an account?
