Exploring Bar Graphs for 1st Graders
Interactive Video
•
Mathematics
•
6th - 10th Grade
•
Practice Problem
•
Hard
+5
Standards-aligned

Aiden Montgomery
Used 2+ times
FREE Resource
Standards-aligned
Read more
10 questions
Show all answers
1.
MULTIPLE CHOICE QUESTION
30 sec • 1 pt
What is the primary purpose of a bar graph?
To illustrate geographical data
To compare numerical values of different categories
To display data over time
To show the relationship between two variables
2.
MULTIPLE CHOICE QUESTION
30 sec • 1 pt
Which dinosaur received the most votes according to the bar graph?
None, they all received the same number of votes
T-Rex
Triceratops
Stegosaurus
Tags
CCSS.2.MD.D.10
3.
MULTIPLE CHOICE QUESTION
30 sec • 1 pt
How can bar graphs help in comparing data?
By illustrating data trends over time
By showing data in a pie chart format
By allowing comparison of lengths of bars to analyze data
By using different colors to represent data
Tags
CCSS.3.MD.B.3
4.
MULTIPLE CHOICE QUESTION
30 sec • 1 pt
What does the length of a bar in a bar graph represent?
The geographical location of the data
The numerical value or frequency of the data
The time period the data covers
The category of the data
5.
MULTIPLE CHOICE QUESTION
30 sec • 1 pt
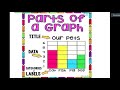
What is a good title for a bar graph showing children's favorite art tools?
Art Tools in Schools
Our Favorite Art Tools
The Best Art Tools
Children's Choices of Art Tools
Tags
CCSS.2.MD.D.10
6.
MULTIPLE CHOICE QUESTION
30 sec • 1 pt
How many children chose paintbrushes as their favorite art tool?
Six
Four
Two
Eight
Tags
CCSS.1.MD.C.4
7.
MULTIPLE CHOICE QUESTION
30 sec • 1 pt
How many more children chose paintbrushes over crayons?
Four
Eight
Two
Six
Tags
CCSS.2.MD.D.10
Access all questions and much more by creating a free account
Create resources
Host any resource
Get auto-graded reports
Continue with Google

Continue with Email
Continue with Classlink
Continue with Clever
or continue with
Microsoft
%20(1).png)
Apple
Others
Already have an account?
