- Resource Library
- Math
- Probability And Statistics
- Normal Distribution
- Exploring Normal Distribution Concepts And Applications
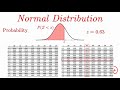
Exploring Normal Distribution Concepts and Applications
Interactive Video
•
Mathematics
•
9th - 12th Grade
•
Practice Problem
•
Hard
Standards-aligned

Sophia Harris
FREE Resource
Standards-aligned
Read more
10 questions
Show all answers
1.
MULTIPLE CHOICE QUESTION
30 sec • 1 pt
What shape is commonly associated with the normal distribution?
Linear slope
Circular shape
Exponential curve
Symmetric bell curve
Tags
CCSS.HSS.ID.A.4
2.
MULTIPLE CHOICE QUESTION
30 sec • 1 pt
What percentage of data lies within one standard deviation of the mean in a normal distribution?
68%
95%
99.7%
50%
Tags
CCSS.HSS.ID.A.4
3.
MULTIPLE CHOICE QUESTION
30 sec • 1 pt
In the context of normal distribution, what does the standard deviation measure?
Variability or spread of the data
Central value of the data
Skewness of the data
Kurtosis of the data
4.
MULTIPLE CHOICE QUESTION
30 sec • 1 pt
What is the purpose of standardizing data in the context of normal distribution?
To compare data from different distributions
To increase the standard deviation
To simplify the calculation of means
To eliminate the need for data
Tags
CCSS.HSS.ID.A.4
5.
MULTIPLE CHOICE QUESTION
30 sec • 1 pt
What does a Z-score represent in a standardized normal distribution?
Number of standard deviations a data point is from the mean
Total number of data points
Probability of occurrence of a data point
Mean of the distribution
6.
MULTIPLE CHOICE QUESTION
30 sec • 1 pt
How do you find the probability associated with a Z-score using a Z-chart?
Divide the Z-score by the total number of data points
Add all Z-scores together
Multiply the Z-score by the standard deviation
Locate the Z-score on the chart and find the corresponding probability
Tags
CCSS.HSS.ID.A.4
7.
MULTIPLE CHOICE QUESTION
30 sec • 1 pt
What does the area to the left of a Z-score in a Z-chart represent?
Probability of a Z-score being less than the given value
Mean deviation from the Z-score
Probability of a Z-score being more than the given value
Total number of Z-scores
Tags
CCSS.HSS.ID.A.4
Access all questions and much more by creating a free account
Create resources
Host any resource
Get auto-graded reports
Continue with Google

Continue with Email
Continue with Classlink
Continue with Clever
or continue with
Microsoft
%20(1).png)
Apple
Others
Already have an account?
Popular Resources on Wayground

15 questions
Fractions on a Number Line
Quiz
•
3rd Grade
20 questions
Equivalent Fractions
Quiz
•
3rd Grade
25 questions
Multiplication Facts
Quiz
•
5th Grade
29 questions
Alg. 1 Section 5.1 Coordinate Plane
Quiz
•
9th Grade
22 questions
fractions
Quiz
•
3rd Grade
11 questions
FOREST Effective communication
Lesson
•
KG
20 questions
Main Idea and Details
Quiz
•
5th Grade
20 questions
Context Clues
Quiz
•
6th Grade
Discover more resources for Mathematics
29 questions
Alg. 1 Section 5.1 Coordinate Plane
Quiz
•
9th Grade
20 questions
Graphing Inequalities on a Number Line
Quiz
•
6th - 9th Grade
20 questions
Box and Whisker Plots
Quiz
•
9th Grade
18 questions
Exponential Growth and Decay
Quiz
•
9th Grade
20 questions
Function or Not a Function
Quiz
•
8th - 9th Grade
20 questions
SSS/SAS
Quiz
•
9th - 12th Grade
14 questions
Making Inferences From Samples
Quiz
•
7th - 12th Grade
23 questions
CCG - CH8 Polygon angles and area Review
Quiz
•
9th - 12th Grade