Interpreting Dot Plots and Histograms
Interactive Video
•
Mathematics
•
6th - 10th Grade
•
Practice Problem
•
Hard
+1
Standards-aligned

Lucas Foster
FREE Resource
Standards-aligned
Read more
10 questions
Show all answers
1.
MULTIPLE CHOICE QUESTION
30 sec • 1 pt
What is the primary purpose of using graphs in data analysis?
To increase the amount of data
To visualize mathematical data clearly
To confuse the audience
To make the data look more complex
Tags
CCSS.6.SP.B.4
CCSS.HSS.ID.A.1
2.
MULTIPLE CHOICE QUESTION
30 sec • 1 pt
What characteristic of Chen's class height data can be observed from the dot plot?
The data is skewed to the right
The data shows no clear pattern
The data is skewed to the left
The data is symmetrical
3.
MULTIPLE CHOICE QUESTION
30 sec • 1 pt
What is the most common height in Chen's class according to the dot plot?
149 centimeters
136 centimeters
140 centimeters
143 centimeters
Tags
CCSS.2.MD.D.9
4.
MULTIPLE CHOICE QUESTION
30 sec • 1 pt
Why might a histogram be preferred over a dot plot in some cases?
It groups data into bins for a clearer overview
It shows exact values for each data point
It requires less space to draw
It is easier to identify outliers
5.
MULTIPLE CHOICE QUESTION
30 sec • 1 pt
What does each bar in a histogram represent?
The maximum value in the data set
A range of data grouped into bins
A single data point
The average of a group of data
Tags
CCSS.6.SP.B.4
CCSS.HSS.ID.A.1
6.
MULTIPLE CHOICE QUESTION
30 sec • 1 pt
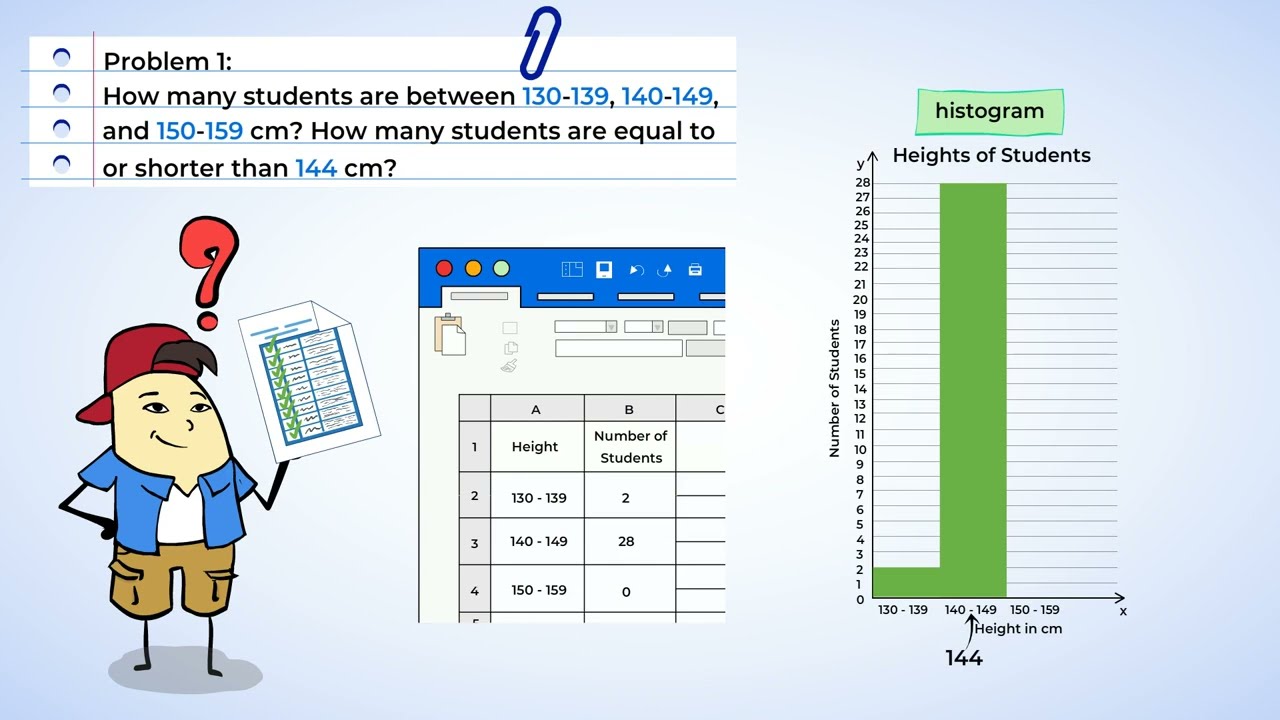
How can you determine the most frequent height range in Chen's class from the histogram?
By finding the tallest bar
By measuring the width of the bars
By looking for outliers
By counting the number of bins
Tags
CCSS.6.SP.B.4
CCSS.HSS.ID.A.1
7.
MULTIPLE CHOICE QUESTION
30 sec • 1 pt
Why can't the exact number of students shorter than 140 centimeters be determined from the histogram?
Because the histogram is incorrectly drawn
Because the histogram only shows data above 140 centimeters
Because the data is not accurate
Because the histogram does not show individual data points
Tags
CCSS.2.MD.D.9
Access all questions and much more by creating a free account
Create resources
Host any resource
Get auto-graded reports
Continue with Google

Continue with Email
Continue with Classlink
Continue with Clever
or continue with
Microsoft
%20(1).png)
Apple
Others
Already have an account?
Popular Resources on Wayground

15 questions
Fractions on a Number Line
Quiz
•
3rd Grade
20 questions
Equivalent Fractions
Quiz
•
3rd Grade
25 questions
Multiplication Facts
Quiz
•
5th Grade
29 questions
Alg. 1 Section 5.1 Coordinate Plane
Quiz
•
9th Grade
22 questions
fractions
Quiz
•
3rd Grade
11 questions
FOREST Effective communication
Lesson
•
KG
20 questions
Main Idea and Details
Quiz
•
5th Grade
20 questions
Context Clues
Quiz
•
6th Grade
Discover more resources for Mathematics
29 questions
Alg. 1 Section 5.1 Coordinate Plane
Quiz
•
9th Grade
36 questions
6th Grade Math STAAR Review
Quiz
•
6th Grade
14 questions
Volume of rectangular prisms
Quiz
•
7th Grade
14 questions
finding slope from a graph
Quiz
•
8th Grade
20 questions
Graphing Inequalities on a Number Line
Quiz
•
6th - 9th Grade
23 questions
Solve and Graph Inequalities
Quiz
•
6th Grade
15 questions
Distributive Property & Review
Quiz
•
6th Grade
10 questions
Mean, Median, Mode, and Range
Quiz
•
7th Grade