Exploring Positive and Negative Correlation
Interactive Video
•
Mathematics
•
8th - 12th Grade
•
Practice Problem
•
Hard
Standards-aligned

Jackson Turner
Used 1+ times
FREE Resource
Standards-aligned
Read more
10 questions
Show all answers
1.
MULTIPLE CHOICE QUESTION
30 sec • 1 pt
What is the primary purpose of a scatter plot?
To show the frequency of data points
To display a single set of data
To create a bar chart
To compare two sets of data as ordered pairs
Tags
CCSS.8.SP.A.1
2.
MULTIPLE SELECT QUESTION
30 sec • 1 pt
In the first example, what were the x and y coordinates used?
Years and income
Students per computer and years
Average annual rainfall and temperature
Students per computer and years
Tags
CCSS.HSF-LE.A.1B
3.
MULTIPLE CHOICE QUESTION
30 sec • 1 pt
In the example with average annual rainfall and temperature, what was being determined?
If temperature decreases with more rainfall
If income increases with years
If temperature is higher in years with more rainfall
If students per computer increases with years
Tags
CCSS.HSF-LE.A.1B
4.
MULTIPLE CHOICE QUESTION
30 sec • 1 pt
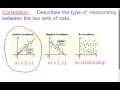
What does a positive correlation indicate?
As x increases, y increases
As x increases, y remains constant
There is no relationship between x and y
As x increases, y decreases
Tags
CCSS.HSS.ID.B.5
5.
MULTIPLE CHOICE QUESTION
30 sec • 1 pt
What type of correlation is shown if the line through the points has a positive slope?
Inverse correlation
Positive correlation
No correlation
Negative correlation
Tags
CCSS.HSS.ID.B.5
6.
MULTIPLE CHOICE QUESTION
30 sec • 1 pt
How do you identify a negative correlation on a scatter plot?
The points form a vertical line
The line has a negative slope
The line has a positive slope
The points form a horizontal line
Tags
CCSS.HSS.ID.B.5
7.
MULTIPLE CHOICE QUESTION
30 sec • 1 pt
What does it mean if there is no correlation in a scatter plot?
The points form a cluster
The points form a clear line
The points are randomly scattered
The points form a curve
Tags
CCSS.HSS.ID.B.5
Access all questions and much more by creating a free account
Create resources
Host any resource
Get auto-graded reports
Continue with Google

Continue with Email
Continue with Classlink
Continue with Clever
or continue with
Microsoft
%20(1).png)
Apple
Others
Already have an account?
Popular Resources on Wayground

7 questions
History of Valentine's Day
Interactive video
•
4th Grade
15 questions
Fractions on a Number Line
Quiz
•
3rd Grade
20 questions
Equivalent Fractions
Quiz
•
3rd Grade
25 questions
Multiplication Facts
Quiz
•
5th Grade
22 questions
fractions
Quiz
•
3rd Grade
15 questions
Valentine's Day Trivia
Quiz
•
3rd Grade
20 questions
Main Idea and Details
Quiz
•
5th Grade
20 questions
Context Clues
Quiz
•
6th Grade
Discover more resources for Mathematics
20 questions
Laws of Exponents
Quiz
•
8th Grade
20 questions
Graphing Inequalities on a Number Line
Quiz
•
6th - 9th Grade
20 questions
Exponent Properties
Quiz
•
9th Grade
16 questions
2022 Winter Olympics Medal Table
Passage
•
6th - 8th Grade
20 questions
Complementary Supplementary Vertical Adjacent Angles
Quiz
•
8th Grade
20 questions
One Step equations addition and subtraction
Quiz
•
5th - 8th Grade
12 questions
Volume of cones and cylinders
Quiz
•
8th Grade
20 questions
Slope from a Graph
Quiz
•
8th Grade