Interpreting Line Graphs: Key Concepts and Steps
Interactive Video
•
Mathematics
•
6th - 10th Grade
•
Practice Problem
•
Hard
+2
Standards-aligned

Olivia Brooks
FREE Resource
Standards-aligned
Read more
10 questions
Show all answers
1.
MULTIPLE CHOICE QUESTION
30 sec • 1 pt
What is the primary purpose of a line graph?
To show how things change over time or relate to each other
To show the distribution of data
To display data in a tabular format
To compare different categories
2.
MULTIPLE CHOICE QUESTION
30 sec • 1 pt
What does the x-axis on a line graph represent?
Dependent variable
Independent variable
Control variable
Constant variable
3.
MULTIPLE CHOICE QUESTION
30 sec • 1 pt
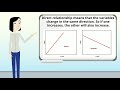
What type of relationship is shown if both variables increase together?
Inverse relationship
Exponential relationship
Direct relationship
Non-linear relationship
Tags
CCSS.HSF-LE.A.1B
4.
MULTIPLE CHOICE QUESTION
30 sec • 1 pt
What does a straight line on a graph indicate?
Non-linear relationship
Inverse relationship
Linear relationship
Exponential relationship
Tags
CCSS.8.F.A.3
5.
MULTIPLE CHOICE QUESTION
30 sec • 1 pt
In the example of mass vs. KE, what is the independent variable?
Speed
Time
Mass
KE
Tags
CCSS.8.EE.B.5
6.
MULTIPLE CHOICE QUESTION
30 sec • 1 pt
What pattern is observed in the KE as mass increases in the first example?
KE increases
KE fluctuates
KE decreases
KE remains constant
Tags
CCSS.HSF.IF.A.1
7.
MULTIPLE CHOICE QUESTION
30 sec • 1 pt
In the second example, what does the y-axis represent?
KE
Mass
Number of organisms
Year
Access all questions and much more by creating a free account
Create resources
Host any resource
Get auto-graded reports
Continue with Google

Continue with Email
Continue with Classlink
Continue with Clever
or continue with
Microsoft
%20(1).png)
Apple
Others
Already have an account?
