Speed Calculating & Graphing 7.7 A & C
Authored by Kaitlyn Thornton
Physics
8th Grade
NGSS covered
Used 11+ times

AI Actions
Add similar questions
Adjust reading levels
Convert to real-world scenario
Translate activity
More...
Content View
Student View
10 questions
Show all answers
1.
MULTIPLE CHOICE QUESTION
30 sec • 1 pt
A car travels a distance of 150 kilometers in 3 hours. What is the average speed of the car in kilometers per hour?
45 km/h
50 km/h
55 km/h
60 km/h
Tags
TEKS.SCI.7.7A
2.
MULTIPLE CHOICE QUESTION
30 sec • 1 pt
A train travels 240 kilometers in 4 hours. What is the average speed of the train in kilometers per hour?
50 km/h
55 km/h
60 km/h
65 km/h
Tags
TEKS.SCI.7.7A
3.
MULTIPLE CHOICE QUESTION
30 sec • 1 pt

A runner wanted to see if his speed would change on different track surfaces. He ran at a comfortable pace on grass, gravel, concrete, and turf. He measured the amount of time it took to run 1,000 meters. What was his fastest time?
A runner wanted to see if his speed would change on different track surfaces. He ran at a comfortable pace on grass, gravel, concrete, and turf. He measured the amount of time it took to run 1,000 meters. What was his fastest time?
161 m/min
175 m/min
200 m/min
182 m/min
Tags
NGSS.MS-PS3-1
4.
MULTIPLE CHOICE QUESTION
30 sec • 1 pt

Some students were investigating the speed of a toy car they built. They
performed two trials and recorded their data in the table below.
What was the average speed of the toy car during the two trials to the nearest tenth
of a m/s?
1.5 m/s
1.8 m/s
7.7 m/s
0.8 m/s
Tags
NGSS.MS-PS3-1
5.
MULTIPLE CHOICE QUESTION
30 sec • 1 pt

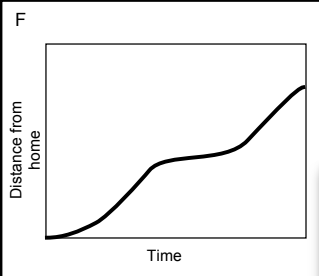
What does this graph represent?
6.
MULTIPLE CHOICE QUESTION
30 sec • 1 pt

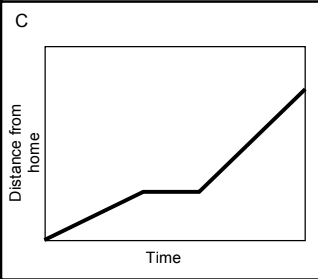
What does this graph represent?
Tags
NGSS.MS-PS3-1
7.
MULTIPLE CHOICE QUESTION
30 sec • 1 pt
What two measurements are necessary for calculating speed?


Access all questions and much more by creating a free account
Create resources
Host any resource
Get auto-graded reports
Continue with Google

Continue with Email
Continue with Classlink
Continue with Clever
or continue with
Microsoft
%20(1).png)
Apple
Others
Already have an account?
