Interpreting Data from Frequency Tables
Interactive Video
•
Mathematics
•
4th - 5th Grade
•
Practice Problem
•
Hard

Jennifer Brown
FREE Resource
5 questions
Show all answers
1.
MULTIPLE CHOICE QUESTION
30 sec • 1 pt
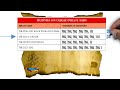
What does each tally mark represent in the frequency table?
One pirate ship
One mutiny
One day at sea
One treasure found
2.
MULTIPLE CHOICE QUESTION
30 sec • 1 pt
How many mutinies were recorded on the Pink and Black Polka Dot Pearl?
28
34
27
36
3.
MULTIPLE CHOICE QUESTION
30 sec • 1 pt
Which ship had the highest number of mutinies?
The Pink and Black Polka Dot Pearl
The Jolly Lodger
The Frying Dutchman
The Lazy Seal
4.
MULTIPLE CHOICE QUESTION
30 sec • 1 pt
How many more mutinies occurred on the Jolly Lodger compared to the Frying Dutchman?
6
9
7
5
5.
MULTIPLE CHOICE QUESTION
30 sec • 1 pt
What is the difference in total mutinies between the two ships with the most and the two ships with the least mutinies?
10
20
15
25
Access all questions and much more by creating a free account
Create resources
Host any resource
Get auto-graded reports
Continue with Google

Continue with Email
Continue with Classlink
Continue with Clever
or continue with
Microsoft
%20(1).png)
Apple
Others
Already have an account?
Similar Resources on Wayground
Popular Resources on Wayground

15 questions
Fractions on a Number Line
Quiz
•
3rd Grade
20 questions
Equivalent Fractions
Quiz
•
3rd Grade
25 questions
Multiplication Facts
Quiz
•
5th Grade
54 questions
Analyzing Line Graphs & Tables
Quiz
•
4th Grade
22 questions
fractions
Quiz
•
3rd Grade
20 questions
Main Idea and Details
Quiz
•
5th Grade
20 questions
Context Clues
Quiz
•
6th Grade
15 questions
Equivalent Fractions
Quiz
•
4th Grade
Discover more resources for Mathematics
25 questions
Multiplication Facts
Quiz
•
5th Grade
54 questions
Analyzing Line Graphs & Tables
Quiz
•
4th Grade
15 questions
Equivalent Fractions
Quiz
•
4th Grade
16 questions
Interpreting Line Graphs & Double Tables
Quiz
•
4th Grade
10 questions
Multiplying Fractions
Quiz
•
5th Grade
77 questions
Mixed Multiplication and Division Facts
Quiz
•
4th Grade
10 questions
Data Collection
Quiz
•
4th Grade
19 questions
Equivalent Fractions
Quiz
•
4th Grade