LATIHAN SOAL STATISTIKA
Authored by Desy Triantika
Mathematics
7th Grade

AI Actions
Add similar questions
Adjust reading levels
Convert to real-world scenario
Translate activity
More...
Content View
Student View
10 questions
Show all answers
1.
MULTIPLE CHOICE QUESTION
5 mins • 10 pts

Diagram batang berikut ini menunjukkan produksi pupuk sebuah pabrik.
Selisih produksi pupuk bulan Maret dan Mei adalah...
14 ton
6 ton
4 ton
2 ton
2.
MULTIPLE CHOICE QUESTION
30 sec • 10 pts

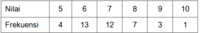
Selisih banyak siswa yang memperoleh nilai 8 dan 10 adalah ... .
2
3
4
5
3.
MULTIPLE CHOICE QUESTION
30 sec • 10 pts
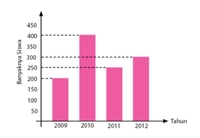
Data siswa SDN Durensewu I dari Tahun 2009 sampai Tahun 2012. Selisih banyaknya siswa tahun 2012 dan tahun 2009 adalah …
25 orang
50 orang
75 orang
100 orang
4.
MULTIPLE CHOICE QUESTION
30 sec • 10 pts

Berapa persentase siswa yang memiliki berat badan 42 kg?
15%
25%
35%
45%
5.
MULTIPLE CHOICE QUESTION
30 sec • 10 pts

Selisih siswa yang memiliki nilai tertinggi dan terendah adalah ...
6
10
30
40
6.
MULTIPLE CHOICE QUESTION
30 sec • 10 pts

Perhatikan tabel berikut.
Berdasarkan data di atas, pernyataan yang tepat adalah . . .
nilai rata-rata MAT kelas 7A tidak lebih baik dari kelas 7B
nilai rata-rata IPS paling rendah
nilai rata-rata kelas 7A lebih baik dari kelas 7B
jumlah nilai kelas 7B lebih tinggi dari jumlah nilai kelas 7A
7.
MULTIPLE CHOICE QUESTION
45 sec • 10 pts
Banyak siswa yang mendapatkan nilai lebih dari 7 pada tabel tersebut adalah …
11 orang
15 orang
17 orang
27 orang


Access all questions and much more by creating a free account
Create resources
Host any resource
Get auto-graded reports
Continue with Google

Continue with Email
Continue with Classlink
Continue with Clever
or continue with
Microsoft
%20(1).png)
Apple
Others
Already have an account?
