
Correlation Coefficient Warmup 2
Quiz
•
Mathematics
•
9th - 12th Grade
•
Practice Problem
•
Hard
Standards-aligned
Michelle McFerren
Used 2+ times
FREE Resource
Enhance your content in a minute
7 questions
Show all answers
1.
MULTIPLE CHOICE QUESTION
2 mins • 1 pt
A study compared the number of years of education and a person's annual salary. The correlation coefficient of the data was r = 0.913. Which conclusion can be made using the correlation coefficient?
There is a strong positive correlation.
There is a strong negative correlation.
There is no correlation.
There is a weak positive correlation.
Answer explanation
The correlation coefficient r = 0.913 indicates a strong positive correlation between years of education and annual salary, meaning as education increases, salary tends to increase as well.
Tags
CCSS.HSS.ID.C.8
2.
MULTIPLE CHOICE QUESTION
2 mins • 1 pt

What COULD be the approximate value of the correlation coefficient for the scatter plot?
-.851
-.162
0.211
0.905
Answer explanation
The correlation coefficient of 0.905 indicates a strong positive relationship between the variables in the scatter plot. This suggests that as one variable increases, the other tends to increase as well, making it the correct choice.
Tags
CCSS.HSS.ID.C.8
3.
MULTIPLE CHOICE QUESTION
2 mins • 1 pt
Which value of r represents data with a strong negative correlation between two data sets?
-1.07
-0.89
-0.14
0.92
Answer explanation
A strong negative correlation is indicated by values close to -1. Among the options, -0.89 is the closest to -1, representing a strong negative correlation, while -1.07 is not a valid correlation coefficient.
Tags
CCSS.HSS.ID.B.5
4.
MULTIPLE CHOICE QUESTION
2 mins • 1 pt
Which value of r represents data with a strong positive correlation between two data sets?
0.89
0.34
1.04
0.01
Answer explanation
A value of 0.89 indicates a strong positive correlation, meaning as one data set increases, the other tends to increase as well. Values closer to 1 signify stronger correlations, while 0.34, 0.01, and 1.04 do not represent strong positive correlations.
Tags
CCSS.HSS.ID.B.5
5.
MULTIPLE CHOICE QUESTION
2 mins • 1 pt
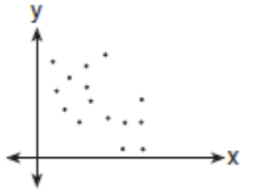
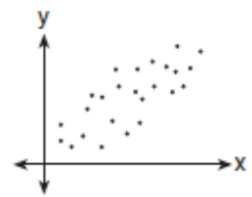
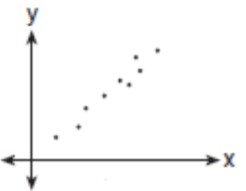
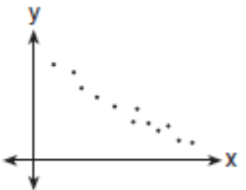
Which graph represents data that has a correlation coefficient close to -1?
Tags
CCSS.HSS.ID.C.8
6.
MULTIPLE CHOICE QUESTION
2 mins • 1 pt
Which scatter plot diagram shows the strongest positive correlation?
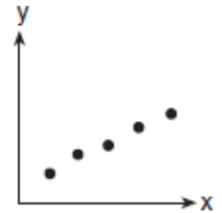
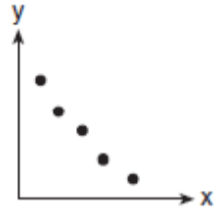
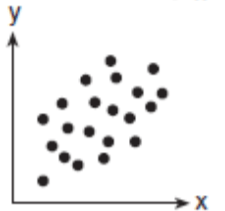
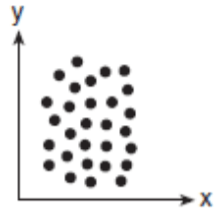
Tags
CCSS.HSS.ID.B.5
7.
MULTIPLE CHOICE QUESTION
2 mins • 1 pt
In a science lab, Thelma determined the kinetic energy of an object at various velocities, V, and found the correlation coefficient between kinetic energy and velocity to be 0.872. Which graph shows this relationship?


Tags
CCSS.HSS.ID.C.8
Access all questions and much more by creating a free account
Create resources
Host any resource
Get auto-graded reports

Continue with Google

Continue with Email

Continue with Classlink

Continue with Clever
or continue with

Microsoft
%20(1).png)
Apple
Others
Already have an account?
Similar Resources on Wayground

10 questions
Arithematic progressions
Quiz
•
10th Grade

12 questions
Vlastnosti funkcií
Quiz
•
9th Grade

10 questions
9ºAno - Probabilidade/Fatoração
Quiz
•
9th Grade

10 questions
אנליטית -ישר
Quiz
•
12th Grade

10 questions
แบบทดสอบ เรื่อง ปริมาตรและพื้นที่ผิวของพีระมิด
Quiz
•
3rd Grade - University

10 questions
Numeri Naturali by Mandara e Colasuonno
Quiz
•
9th Grade

10 questions
Limit Tak hingga 1
Quiz
•
12th Grade - University

10 questions
Ecuații de gr 2
Quiz
•
1st - 10th Grade
Popular Resources on Wayground

15 questions
Fractions on a Number Line
Quiz
•
3rd Grade

20 questions
Equivalent Fractions
Quiz
•
3rd Grade

25 questions
Multiplication Facts
Quiz
•
5th Grade

54 questions
Analyzing Line Graphs & Tables
Quiz
•
4th Grade

22 questions
fractions
Quiz
•
3rd Grade

20 questions
Main Idea and Details
Quiz
•
5th Grade

20 questions
Context Clues
Quiz
•
6th Grade

15 questions
Equivalent Fractions
Quiz
•
4th Grade
Discover more resources for Mathematics

20 questions
Graphing Inequalities on a Number Line
Quiz
•
6th - 9th Grade

18 questions
SAT Prep: Ratios, Proportions, & Percents
Quiz
•
9th - 10th Grade

12 questions
Exponential Growth and Decay
Quiz
•
9th Grade

12 questions
Parallel Lines Cut by a Transversal
Quiz
•
10th Grade

12 questions
Add and Subtract Polynomials
Quiz
•
9th - 12th Grade

15 questions
Combine Like Terms and Distributive Property
Quiz
•
8th - 9th Grade

20 questions
Function or Not a Function
Quiz
•
8th - 9th Grade

10 questions
Elijah McCoy: Innovations and Impact in Black History
Interactive video
•
6th - 10th Grade
