Scatter Plot Analysis and Interpretation
Interactive Video
•
Mathematics
•
9th - 10th Grade
•
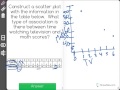
Practice Problem
•
Hard

Olivia Brooks
FREE Resource
Read more
8 questions
Show all answers
1.
MULTIPLE CHOICE QUESTION
30 sec • 1 pt
What is the primary purpose of a scatter plot?
To show the relationship between two variables
To list data in a tabular form
To display the frequency of data
To calculate the average of data
2.
MULTIPLE CHOICE QUESTION
30 sec • 1 pt
In the context of the video, what does the x-axis represent?
Days of the week
Math scores
Number of students
TV watching hours per day
3.
MULTIPLE CHOICE QUESTION
30 sec • 1 pt
What is the range of TV watching hours used in the scatter plot?
2 to 8 hours
0 to 6 hours
1 to 5 hours
0 to 10 hours
4.
MULTIPLE CHOICE QUESTION
30 sec • 1 pt
What is the starting point for math scores on the y-axis?
37
49
40
0
5.
MULTIPLE CHOICE QUESTION
30 sec • 1 pt
Which data point is plotted at the coordinates (0, 99)?
(6, 99)
(6, 49)
(0, 99)
(0, 49)
6.
MULTIPLE CHOICE QUESTION
30 sec • 1 pt
What type of trend is observed in the scatter plot?
Cyclical trend
Downward linear trend
No trend
Upward linear trend
7.
MULTIPLE CHOICE QUESTION
30 sec • 1 pt
What does a negative association in the scatter plot indicate?
As one variable increases, the other also increases
There is no relationship between the variables
Both variables remain constant
As one variable increases, the other decreases
Access all questions and much more by creating a free account
Create resources
Host any resource
Get auto-graded reports
Continue with Google

Continue with Email
Continue with Classlink
Continue with Clever
or continue with
Microsoft
%20(1).png)
Apple
Others
Already have an account?
Popular Resources on Wayground

15 questions
Fractions on a Number Line
Quiz
•
3rd Grade
20 questions
Equivalent Fractions
Quiz
•
3rd Grade
25 questions
Multiplication Facts
Quiz
•
5th Grade
22 questions
fractions
Quiz
•
3rd Grade
20 questions
Main Idea and Details
Quiz
•
5th Grade
20 questions
Context Clues
Quiz
•
6th Grade
15 questions
Equivalent Fractions
Quiz
•
4th Grade
20 questions
Figurative Language Review
Quiz
•
6th Grade
Discover more resources for Mathematics
20 questions
Graphing Inequalities on a Number Line
Quiz
•
6th - 9th Grade
12 questions
Exponential Growth and Decay
Quiz
•
9th Grade
20 questions
Exponent Rules Review
Quiz
•
8th - 9th Grade
25 questions
Complementary and Supplementary Angles
Quiz
•
7th - 10th Grade
12 questions
Add and Subtract Polynomials
Quiz
•
9th - 12th Grade
13 questions
Model Exponential Growth and Decay Scenarios
Quiz
•
9th - 12th Grade
15 questions
Combine Like Terms and Distributive Property
Quiz
•
8th - 9th Grade
27 questions
7.2.3 Quadrilateral Properties
Quiz
•
9th - 12th Grade