
Unit 7 Review
Authored by SUSAN SUDDOTH
Mathematics
3rd Grade
CCSS covered
Used 8+ times

AI Actions
Add similar questions
Adjust reading levels
Convert to real-world scenario
Translate activity
More...
Content View
Student View
25 questions
Show all answers
1.
MULTIPLE CHOICE QUESTION
2 mins • 1 pt

How many more people liked soccer than liked baseball?
2 people
3 people
4 people
7 people
Tags
CCSS.3.OA.D.8
2.
MULTIPLE CHOICE QUESTION
15 mins • 1 pt

How many students prefer soccer as their favorite sport?
10
7
6
9
3.
MULTIPLE CHOICE QUESTION
45 sec • 1 pt

How many more people like purple than red?
Tags
CCSS.3.OA.D.8
4.
MULTIPLE CHOICE QUESTION
5 mins • 1 pt

On which day was the number of sugar cookies made at the bakery greater than the number of chocolate cookies?
5.
MULTIPLE CHOICE QUESTION
1 min • 1 pt

Students in 3rd grade collected data on their favorite subject and recorded it on the table shown. Which graph shows this information?
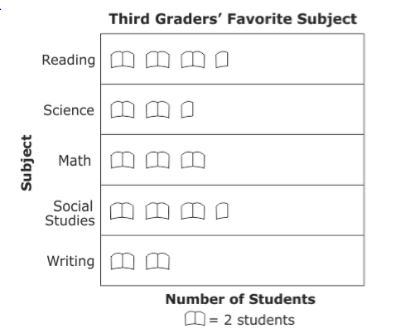
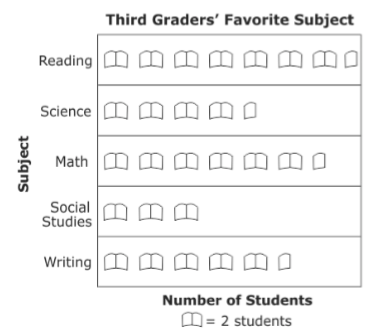
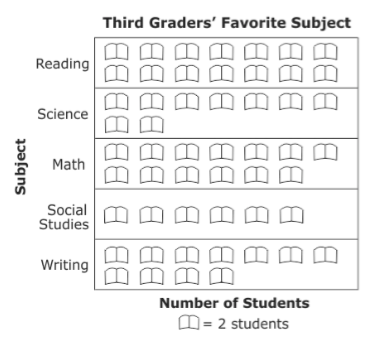
6.
MULTIPLE CHOICE QUESTION
1 min • 1 pt

In the chart , a music store listed the number of CDs sold each month for 6 months. Which graph correctly represents the information in the chart?
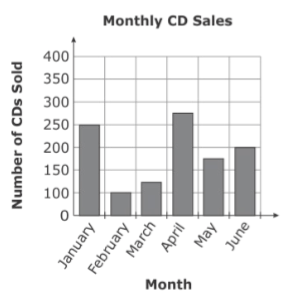
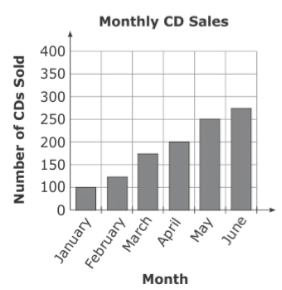
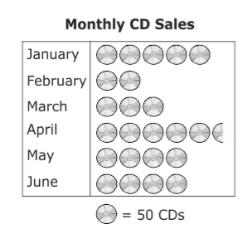
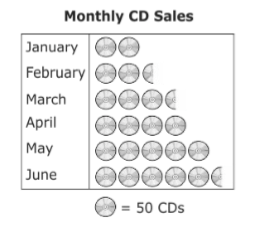
7.
MULTIPLE CHOICE QUESTION
1 min • 1 pt

Rita went bird watching. The picture graph below shows the number and types of birds she saw. Which data set was used to make this graph?


Access all questions and much more by creating a free account
Create resources
Host any resource
Get auto-graded reports

Continue with Google

Continue with Email

Continue with Classlink

Continue with Clever
or continue with

Microsoft
%20(1).png)
Apple
Others
Already have an account?
Similar Resources on Wayground

20 questions
Math Quiz
Quiz
•
3rd Grade

20 questions
3A1 Mathematics Algebraic Expressions and Formulae
Quiz
•
8th - 9th Grade

20 questions
polygons and areas Quiz
Quiz
•
8th - 12th Grade

20 questions
Grade 6 Algebra Quiz (Before x and div)
Quiz
•
6th Grade

20 questions
Chapter 11: Statistical Measures
Quiz
•
9th - 12th Grade

20 questions
Converting imperial measurements to metric and vice versa
Quiz
•
6th Grade

20 questions
Name the operation
Quiz
•
2nd - 3rd Grade

20 questions
Unit 2 Semester Review
Quiz
•
8th Grade
Popular Resources on Wayground

15 questions
Fractions on a Number Line
Quiz
•
3rd Grade

20 questions
Equivalent Fractions
Quiz
•
3rd Grade

25 questions
Multiplication Facts
Quiz
•
5th Grade

54 questions
Analyzing Line Graphs & Tables
Quiz
•
4th Grade

22 questions
fractions
Quiz
•
3rd Grade

20 questions
Main Idea and Details
Quiz
•
5th Grade

20 questions
Context Clues
Quiz
•
6th Grade

15 questions
Equivalent Fractions
Quiz
•
4th Grade
Discover more resources for Mathematics

15 questions
Fractions on a Number Line
Quiz
•
3rd Grade

20 questions
Equivalent Fractions
Quiz
•
3rd Grade

22 questions
fractions
Quiz
•
3rd Grade

18 questions
Comparing Fractions with same numerator or denominator
Quiz
•
3rd Grade

12 questions
Fractions on a numberline review
Quiz
•
3rd Grade

10 questions
Area
Quiz
•
3rd Grade

20 questions
Fractions
Quiz
•
3rd Grade

100 questions
100 multiplication facts
Quiz
•
3rd Grade

