Reading Charts, Tables, and Diagrams
Quiz
•
Science
•
9th - 12th Grade
•
Hard
+10
Standards-aligned

Charles Martinez
FREE Resource
Enhance your content
60 questions
Show all answers
1.
MULTIPLE CHOICE QUESTION
30 sec • 1 pt

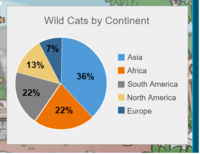
Which continent has 36% of the wild cats?
Asia
Africa
North America
South America
2.
MULTIPLE CHOICE QUESTION
30 sec • 1 pt

Which continent has 13% of wild cats?
Asia
Africa
North America
South America
3.
MULTIPLE CHOICE QUESTION
30 sec • 1 pt

4.
MULTIPLE CHOICE QUESTION
1 min • 1 pt

5.
MULTIPLE CHOICE QUESTION
1 min • 1 pt
What percentage does a whole pie chart represent?
360%
90%
50%
100%
6.
MULTIPLE CHOICE QUESTION
30 sec • 1 pt

Look at the bar graph, "Nicest Fruit". What does the y-axis show?
Types of fruit
Number of people.
7.
MULTIPLE CHOICE QUESTION
30 sec • 1 pt

Look at the bar graph, "Nicest Fruit". What does the x-axis show?
Types of fruit
The number of people.
Tags
NGSS.MS-PS3-1
Create a free account and access millions of resources
Create resources
Host any resource
Get auto-graded reports

Continue with Google

Continue with Email

Continue with Classlink

Continue with Clever
or continue with

Microsoft
%20(1).png)
Apple
Others
By signing up, you agree to our Terms of Service & Privacy Policy
Already have an account?
Similar Resources on Wayground

60 questions
PS Final Exam Review
Quiz
•
10th Grade

56 questions
Year 11 PDHPE Core 2 Revision
Quiz
•
11th - 12th Grade

58 questions
NCFE Review #1 Astronomy
Quiz
•
9th - 12th Grade

57 questions
APES Unit 5 Land and Water Use
Quiz
•
11th - 12th Grade

58 questions
9th Grade Biology Final Exam
Quiz
•
9th Grade

60 questions
Planets Test
Quiz
•
6th - 9th Grade

57 questions
Review for your Earth Science Exam!
Quiz
•
9th Grade

57 questions
Circuits review
Quiz
•
9th - 12th Grade
Popular Resources on Wayground

20 questions
Brand Labels
Quiz
•
5th - 12th Grade

10 questions
Ice Breaker Trivia: Food from Around the World
Quiz
•
3rd - 12th Grade

25 questions
Multiplication Facts
Quiz
•
5th Grade

20 questions
ELA Advisory Review
Quiz
•
7th Grade

15 questions
Subtracting Integers
Quiz
•
7th Grade

22 questions
Adding Integers
Quiz
•
6th Grade

10 questions
Multiplication and Division Unknowns
Quiz
•
3rd Grade

10 questions
Exploring Digital Citizenship Essentials
Interactive video
•
6th - 10th Grade
Discover more resources for Science

10 questions
Exploring Newton's Laws of Motion
Interactive video
•
6th - 10th Grade

10 questions
Exploring Chemical and Physical Changes
Interactive video
•
6th - 10th Grade

10 questions
Exploring the States of Matter
Interactive video
•
6th - 10th Grade

10 questions
Exploring the States of Matter and Thermal Energy
Interactive video
•
6th - 10th Grade

10 questions
Exploring Light and Waves Concepts
Interactive video
•
6th - 10th Grade

16 questions
3.4 Biogeochemical Cycles
Quiz
•
9th Grade

21 questions
Cell Organelles
Quiz
•
9th Grade

10 questions
Exploring Weathering, Erosion, and Deposition Processes
Interactive video
•
6th - 10th Grade


