Interpreting Proportional Graph
Authored by Anthony Clark
Mathematics
7th Grade
CCSS covered

AI Actions
Add similar questions
Adjust reading levels
Convert to real-world scenario
Translate activity
More...
Content View
Student View
20 questions
Show all answers
1.
MULTIPLE CHOICE QUESTION
1 min • 1 pt

True/False: The point (2,1) means to mix 1 quart of green paint with 2 quarts of red paint.
True
False
Tags
CCSS.8.EE.B.5
2.
MULTIPLE CHOICE QUESTION
1 min • 1 pt

True/False: The point (4 , 2) means that 4 cookies were purchased for $2.
True
False
Tags
CCSS.7.RP.A.2D
3.
MULTIPLE CHOICE QUESTION
1 min • 1 pt

Which of the following ordered pairs represents the unit rate?
(0.50, 1)
(2, 1)
(1, 0.50)
(1, 2)
Tags
CCSS.7.RP.A.2D
4.
MULTIPLE CHOICE QUESTION
1 min • 1 pt

What does the point (0,0) represent in context of the situation?
No cookies were sold.
No money is made selling cookies.
No money is made when selling two cookies.
No cookies were sold and no money was made.
Tags
CCSS.HSF.LE.B.5
5.
MULTIPLE CHOICE QUESTION
1 min • 1 pt

What does the ordered pair (20, 3000) represent?
The machine folds 3,000 sheets in 20 minutes.
The machine folds 20 sheets in 3,000 minutes.
There are 3,000 sheets in 20 minutes.
There are 20 sheets in 3,000 minutes.
6.
MATH RESPONSE QUESTION
1 min • 1 pt

Mathematical Equivalence
ON
Tags
CCSS.8.EE.B.5
7.
MULTIPLE CHOICE QUESTION
1 min • 1 pt

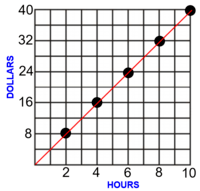
Which statement below accurately represents the graph?
$100 is earned for each hour worked
$200 earned for every 2 hours worked
is the unit rate
$500 is earned for every 8 hours worked
$250 is earned after working 3 hours
Tags
CCSS.7.RP.A.2D


Access all questions and much more by creating a free account
Create resources
Host any resource
Get auto-graded reports
Continue with Google

Continue with Email
Continue with Classlink
Continue with Clever
or continue with
Microsoft
%20(1).png)
Apple
Others
Already have an account?
Similar Resources on Wayground

17 questions
NUMEROS ENTEROS (Interpretación, registro y comparación)
Quiz
•
7th Grade
20 questions
numeri relativi moltiplicazione
Quiz
•
7th Grade
22 questions
Similar Polygons Review
Quiz
•
6th - 7th Grade
20 questions
ECUACIONES
Quiz
•
7th Grade
16 questions
Računanje z odstotki
Quiz
•
7th Grade
20 questions
Kids Math test
Quiz
•
6th - 8th Grade
15 questions
Area of Kites, Rhombuses, and Trapeziums
Quiz
•
7th - 8th Grade
16 questions
EM Graphs of Power Function
Quiz
•
7th Grade
Popular Resources on Wayground
15 questions
Fractions on a Number Line
Quiz
•
3rd Grade
20 questions
Equivalent Fractions
Quiz
•
3rd Grade
25 questions
Multiplication Facts
Quiz
•
5th Grade
29 questions
Alg. 1 Section 5.1 Coordinate Plane
Quiz
•
9th Grade
22 questions
fractions
Quiz
•
3rd Grade
11 questions
FOREST Effective communication
Lesson
•
KG
20 questions
Main Idea and Details
Quiz
•
5th Grade
20 questions
Context Clues
Quiz
•
6th Grade
Discover more resources for Mathematics
14 questions
Volume of rectangular prisms
Quiz
•
7th Grade
20 questions
Graphing Inequalities on a Number Line
Quiz
•
6th - 9th Grade
10 questions
Mean, Median, Mode, and Range
Quiz
•
7th Grade
23 questions
Mean median mode and range
Quiz
•
7th Grade
15 questions
Simple Probability
Quiz
•
7th Grade
15 questions
Volume of Triangular and Rectangular Prisms
Quiz
•
5th - 7th Grade
15 questions
Area and Circumference of a Circle
Quiz
•
7th Grade
13 questions
circumference and Area of a Circle
Quiz
•
7th Grade