Solving Inequalities Quadratics by Graphing
Authored by Anthony Clark
Mathematics
11th Grade
CCSS covered

AI Actions
Add similar questions
Adjust reading levels
Convert to real-world scenario
Translate activity
More...
Content View
Student View
13 questions
Show all answers
1.
MULTIPLE CHOICE QUESTION
1 min • 1 pt

How many zeros does this parabola have?
3
2
0
1
Tags
CCSS.HSF-IF.C.7A
2.
MULTIPLE CHOICE QUESTION
1 min • 1 pt

3.
MULTIPLE CHOICE QUESTION
1 min • 1 pt

Q1. What are the roots of the equation x^2 - 6x + 8 = 0?
A) 4 and 2
B) -4 and -2
C) 4 and -2
D) -4 and 2
4.
MULTIPLE CHOICE QUESTION
1 min • 1 pt

How many solutions does this function have?
two
one
all real numbers
no real solutions
5.
MULTIPLE CHOICE QUESTION
1 min • 1 pt
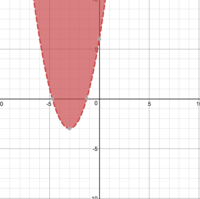
Which inequality is represented by the graph?
y > (x - 3)² - 3
y ≥ (x + 3)² - 3
y > (x + 3)² - 3
y ≥ (x - 3)² - 3
Tags
CCSS.HSF-IF.C.7A
6.
MULTIPLE CHOICE QUESTION
1 min • 1 pt

Which inequality is shown?
y< -x2
y≤ -x2
y> -x2
y≥ -x2
Tags
CCSS.HSF-IF.C.7A
7.
MULTIPLE CHOICE QUESTION
1 min • 1 pt

Which inequality is represented by the graph?
y > -(x - 4)² + 1
y > -(x - 1)² + 4
y < (x - 4)² + 1
y > (x + 4)² + 1
Tags
CCSS.HSF-IF.C.7A


Access all questions and much more by creating a free account
Create resources
Host any resource
Get auto-graded reports
Continue with Google

Continue with Email
Continue with Classlink
Continue with Clever
or continue with
Microsoft
%20(1).png)
Apple
Others
Already have an account?
Similar Resources on Wayground

10 questions
Remedial Ulangan Aplikasi Turunan kelas XII ACM 3
Quiz
•
9th - 12th Grade
10 questions
คณิตศาสตร์ ป.6
Quiz
•
1st Grade - University
9 questions
เลขยกกำลัง
Quiz
•
11th Grade
10 questions
PARCIAL 2 - Unidad III
Quiz
•
10th - 11th Grade
11 questions
Super easy quiz
Quiz
•
9th - 12th Grade
10 questions
Limit Fungsi Aljabar
Quiz
•
11th - 12th Grade
10 questions
ulangan harian limit fungsi aljabar
Quiz
•
11th Grade
16 questions
Stratégies de calcul mental
Quiz
•
7th - 12th Grade
Popular Resources on Wayground
15 questions
Fractions on a Number Line
Quiz
•
3rd Grade
10 questions
Probability Practice
Quiz
•
4th Grade
15 questions
Probability on Number LIne
Quiz
•
4th Grade
20 questions
Equivalent Fractions
Quiz
•
3rd Grade
25 questions
Multiplication Facts
Quiz
•
5th Grade
22 questions
fractions
Quiz
•
3rd Grade
6 questions
Appropriate Chromebook Usage
Lesson
•
7th Grade
10 questions
Greek Bases tele and phon
Quiz
•
6th - 8th Grade
Discover more resources for Mathematics
23 questions
TSI Math Vocabulary
Quiz
•
10th - 12th Grade
80 questions
ACT Math Important Vocabulary
Quiz
•
11th Grade
20 questions
SSS/SAS
Quiz
•
9th - 12th Grade
15 questions
Exponential Growth and Decay Word Problems Practice
Quiz
•
9th - 12th Grade
11 questions
Slopes of Parallel and Perpendicular Lines
Quiz
•
7th - 11th Grade
13 questions
Identify Transformations in Geometry
Quiz
•
8th - 12th Grade
20 questions
Quadratic Transformations Review
Quiz
•
9th - 12th Grade
10 questions
Area of 2D Shapes
Quiz
•
7th - 11th Grade