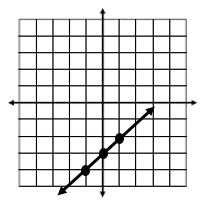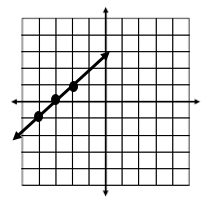
Linear Table, Graph, Equations
Quiz
•
Mathematics
•
8th Grade
•
Practice Problem
•
Hard
+5
Standards-aligned

Anthony Clark
FREE Resource
Enhance your content in a minute
20 questions
Show all answers
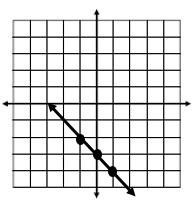
1.
MATH RESPONSE QUESTION
1 min • 2 pts

Write the equation of the line in slope-intercept form.
Mathematical Equivalence
ON
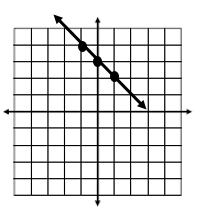
2.
MULTIPLE CHOICE QUESTION
1 min • 1 pt

Which equation best represents the relationship between x and y on the graph?
y = x + 3
y = x -3
y = -x + 3
y = -x - 3
Tags
CCSS.8.F.B.4
CCSS.HSF.LE.A.2
3.
MULTIPLE CHOICE QUESTION
1 min • 1 pt

A water tank currently contains 275 gallons of water. The amount of water in the tank will decrease at a constant rate of 15 gallons per week.
Which function can be used to find t, the total number of gallons of water in the tank after w weeks?
Tags
CCSS.8.F.B.4
CCSS.HSF.LE.A.2
4.
MULTIPLE CHOICE QUESTION
1 min • 1 pt

Write the equation that created this table.
y = 3x - 9
y = 3x + 3
y = -3x + 3
y = 6x + 5
Tags
CCSS.6.EE.C.9
5.
MULTIPLE CHOICE QUESTION
1 min • 1 pt

Which equation can be used to graph the function shown in the table?
y=-2x-4
y=2x-4
y=2x+4
y=-2x+4
Tags
CCSS.8.F.B.4
CCSS.HSF.LE.A.2
6.
MULTIPLE CHOICE QUESTION
1 min • 1 pt

Identify the nature of solution from the graph given.
Consistent and unique solution
Inconsistent : No solution
Tags
CCSS.8.EE.C.8B
7.
MULTIPLE CHOICE QUESTION
1 min • 1 pt

What is the solution?
1
-2
(1, 2)
(1, -1)
Tags
CCSS.8.EE.C.8B
Access all questions and much more by creating a free account
Create resources
Host any resource
Get auto-graded reports

Continue with Google

Continue with Email

Continue with Classlink

Continue with Clever
or continue with

Microsoft
%20(1).png)
Apple
Others
Already have an account?
Similar Resources on Wayground

15 questions
2nd Quarter: Module 1 Quiz
Quiz
•
8th Grade

19 questions
ميل المستقيمات المتعامدة والمتوازية
Quiz
•
8th - 10th Grade

15 questions
Operaciones con matrices
Quiz
•
12th Grade

15 questions
Math 1110 -- College Algebra Midterm Review
Quiz
•
University

19 questions
Matemáticas III de Secundaria - 2T 2 Parcial
Quiz
•
9th Grade

16 questions
AJEDREZ MARILLAC
Quiz
•
11th Grade

22 questions
Factoring Polynomials
Quiz
•
8th - 9th Grade
![Pre-Assessment [Grade 8 Mathematics]](https://cf.quizizz.com/image/image-loader.svg)
15 questions
Pre-Assessment [Grade 8 Mathematics]
Quiz
•
8th Grade
Popular Resources on Wayground

15 questions
Fractions on a Number Line
Quiz
•
3rd Grade

20 questions
Equivalent Fractions
Quiz
•
3rd Grade

25 questions
Multiplication Facts
Quiz
•
5th Grade

54 questions
Analyzing Line Graphs & Tables
Quiz
•
4th Grade

22 questions
fractions
Quiz
•
3rd Grade

20 questions
Main Idea and Details
Quiz
•
5th Grade

20 questions
Context Clues
Quiz
•
6th Grade

15 questions
Equivalent Fractions
Quiz
•
4th Grade
Discover more resources for Mathematics

14 questions
finding slope from a graph
Quiz
•
8th Grade

20 questions
Laws of Exponents
Quiz
•
8th Grade

12 questions
8th U5L9 Linear Models
Quiz
•
8th Grade

20 questions
Graphing Inequalities on a Number Line
Quiz
•
6th - 9th Grade

20 questions
Volume of cylinders, Cones and Spheres
Quiz
•
8th Grade

20 questions
One Step equations addition and subtraction
Quiz
•
5th - 8th Grade

20 questions
Mean, Median, Mode, and Range
Quiz
•
8th Grade

15 questions
Volume of a Cylinder
Quiz
•
8th Grade


