
Ratio Graph Table
6th Grade
•20 Qs

Similar activities
Productos notables 1
8th Grade
•15 Qs
ULANGAN HIMPUNAN KELAS VII
7th Grade
•15 Qs
PTS MATEMATIKA MINAT XII
12th Grade
•20 Qs
Matematika Limas
6th Grade
•15 Qs
Radicales 3º ESO
9th Grade
•15 Qs
Trivia CMAE2020
University
•20 Qs
ULANGAN HARIAN IX 1,2 SMP 18 KENDARI
9th Grade
•20 Qs
Osnovno o razlomcima vrednovanje
5th - 6th Grade
•18 Qs

Ratio Graph Table
Quiz
•
Mathematics
•
6th Grade
•
Practice Problem
•
Hard
+3
Standards-aligned

Anthony Clark
FREE Resource
Enhance your content in a minute
20 questions
Show all answers
1.
MULTIPLE CHOICE QUESTION
1 min • 1 pt

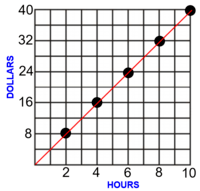
The graph shows the cost of buying paint in 1-gallon buckets. Based on the graph, which dollar amount represents the cost to buy five 1-gallon buckets of paint?
$120
$125
$130
$135
Tags
CCSS.7.RP.A.2D
2.
MULTIPLE CHOICE QUESTION
1 min • 1 pt

What is the missing number in the ratio table?
72
85
76
90
3.
MULTIPLE CHOICE QUESTION
1 min • 1 pt

Is this table proportional?
Yes
No
Tags
CCSS.7.RP.A.2A
4.
MULTIPLE CHOICE QUESTION
1 min • 1 pt

A booth at the State Fair recorded the number of items sold in the chart. What is the ratio of lemonade and sodas sold to the number of candy bars sold?
7:6
6:7
4:3
3:7
Tags
CCSS.6.RP.A.1
CCSS.6.RP.A.2
5.
MULTIPLE CHOICE QUESTION
1 min • 1 pt

14 and 27
14 and 24
14 and 21
14 and 32
6.
MULTIPLE CHOICE QUESTION
1 min • 1 pt

Solve for C in the table.
C= 40
C= 10
C= 9
C= 45
Tags
CCSS.5.OA.B.3
7.
MULTIPLE CHOICE QUESTION
1 min • 1 pt

Does this graph represent a proportional relationship?
No, because it doesn't pass through the origin.
Yes, because it doesn't pass through the origin.
Yes, because it intersects the y axis.
No, because it intersects the x axis.
Tags
CCSS.7.RP.A.2D


Access all questions and much more by creating a free account
Create resources
Host any resource
Get auto-graded reports
Continue with Google

Continue with Email
Continue with Classlink
Continue with Clever
or continue with
Microsoft
%20(1).png)
Apple
Others
Already have an account?
Similar Resources on Wayground
20 questions
Solving systems of equations by substitution_1
Quiz
•
9th Grade
20 questions
POTENCIACIÓN DE NÚMEROS ENTEROS
Quiz
•
8th - 9th Grade
20 questions
ÔN TẬP GIỮA KỲ II - TOÁN 6
Quiz
•
9th - 12th Grade
20 questions
Adolygu
Quiz
•
5th - 6th Grade
20 questions
Angles, Parallel Lines & Transversals
Quiz
•
7th Grade
15 questions
Conocimientos Previos
Quiz
•
5th - 10th Grade
18 questions
Funciones Trigonometricas
Quiz
•
12th Grade
20 questions
Réduction d'expressions littérales
Quiz
•
7th Grade - University
Popular Resources on Wayground
15 questions
Fractions on a Number Line
Quiz
•
3rd Grade
20 questions
Equivalent Fractions
Quiz
•
3rd Grade
25 questions
Multiplication Facts
Quiz
•
5th Grade
54 questions
Analyzing Line Graphs & Tables
Quiz
•
4th Grade
22 questions
fractions
Quiz
•
3rd Grade
20 questions
Main Idea and Details
Quiz
•
5th Grade
20 questions
Context Clues
Quiz
•
6th Grade
15 questions
Equivalent Fractions
Quiz
•
4th Grade
Discover more resources for Mathematics
15 questions
Distributive Property & Review
Quiz
•
6th Grade
20 questions
Writing Algebraic Expressions
Quiz
•
6th Grade
20 questions
Ratios/Rates and Unit Rates
Quiz
•
6th Grade
20 questions
Graphing Inequalities on a Number Line
Quiz
•
6th - 9th Grade
20 questions
One Step Equations
Quiz
•
6th Grade
10 questions
Solving One Step Inequalities
Quiz
•
6th Grade
20 questions
graphing inequalities
Quiz
•
6th - 7th Grade
15 questions
One- Step Equations
Quiz
•
6th Grade