Compare Rates of Tables, Graphs, Rules
Quiz
•
Mathematics
•
8th Grade
•
Hard
+2
Standards-aligned

Anthony Clark
FREE Resource
15 questions
Show all answers
1.
MULTIPLE CHOICE QUESTION
1 min • 1 pt

What is the constant of Proportionality for this table?
1/9
9
8
Tags
CCSS.7.RP.A.2B
2.
MULTIPLE CHOICE QUESTION
1 min • 1 pt

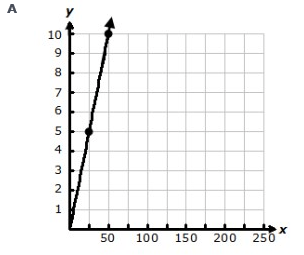
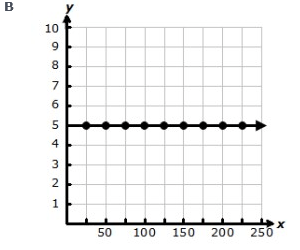
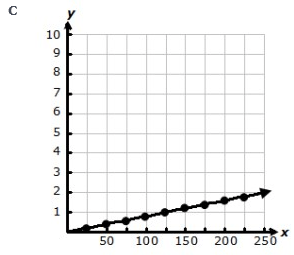
Which graph represents the data?


Tags
CCSS.8.EE.B.5
3.
MULTIPLE CHOICE QUESTION
1 min • 1 pt

Which graph represents the data and shows the unit rate?


Tags
CCSS.8.EE.B.5
4.
MULTIPLE CHOICE QUESTION
1 min • 1 pt

Which statement is the correct unit rate?
5 seconds per foot
5 feet per second
2.5 seconds per foot
2.5 feet per second
Tags
CCSS.7.RP.A.2D
5.
MULTIPLE CHOICE QUESTION
1 min • 1 pt

Based on the graph, explain the unit rate.
The unit rate is 125
The unit rate is 1
Not here
Tags
CCSS.7.RP.A.2D
6.
MULTIPLE CHOICE QUESTION
1 min • 1 pt
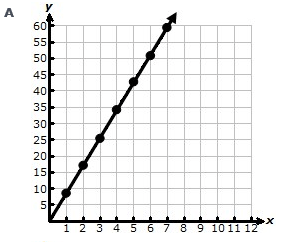
Carter receives $13.50 for every 5 boxes of chocolate he sells. Which graph shows this relationship?
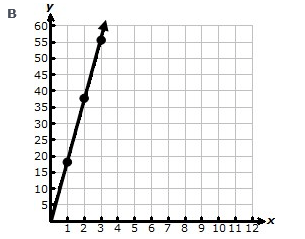
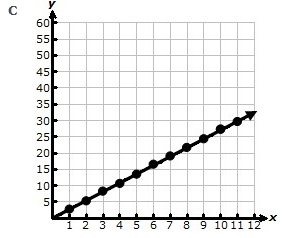
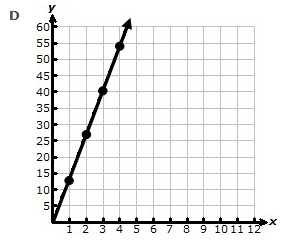
Tags
CCSS.8.EE.B.5
7.
MULTIPLE CHOICE QUESTION
1 min • 1 pt

Which graph shows the same unit rate?


Tags
CCSS.8.EE.B.5
Create a free account and access millions of resources
Similar Resources on Wayground

20 questions
Proportional Relationship Using Graphs Tables and Equations
Quiz
•
7th - 8th Grade

20 questions
Proportional Relationship vs Nonproportional
Quiz
•
8th Grade

20 questions
Proportional vs Nonproportional Relationships Graphs
Quiz
•
8th Grade

20 questions
Proportional Relationships in tables, graphs, equations
Quiz
•
7th - 8th Grade

12 questions
Understanding Proportional Relationships
Quiz
•
6th Grade - University

15 questions
Proportional Equations Tables Graphs
Quiz
•
7th Grade - University

15 questions
Tables Equations and Graph
Quiz
•
7th Grade - University

20 questions
Proportional Equation Graph Table
Quiz
•
7th - 8th Grade
Popular Resources on Wayground

10 questions
Video Games
Quiz
•
6th - 12th Grade

10 questions
Lab Safety Procedures and Guidelines
Interactive video
•
6th - 10th Grade

25 questions
Multiplication Facts
Quiz
•
5th Grade

10 questions
UPDATED FOREST Kindness 9-22
Lesson
•
9th - 12th Grade

22 questions
Adding Integers
Quiz
•
6th Grade

15 questions
Subtracting Integers
Quiz
•
7th Grade

20 questions
US Constitution Quiz
Quiz
•
11th Grade

10 questions
Exploring Digital Citizenship Essentials
Interactive video
•
6th - 10th Grade
Discover more resources for Mathematics

18 questions
Identifying Functions Practice
Quiz
•
8th Grade

24 questions
3.1 Parallel lines cut by a transversal
Quiz
•
8th Grade

20 questions
Slope from a Graph
Quiz
•
8th Grade

15 questions
Dilations
Quiz
•
8th Grade

15 questions
Parallel Lines Cut by a Transversal
Quiz
•
8th Grade

15 questions
Domain and Range of Functions
Quiz
•
8th Grade

10 questions
Literal Equations
Quiz
•
8th Grade

20 questions
Rational and Irrational Numbers
Quiz
•
8th Grade

