
Rate and Graphs
7th Grade
•17 Qs

Similar activities
Intro to Integers
6th - 7th Grade
•20 Qs
Quis persamaan trigonometri
10th - 12th Grade
•15 Qs
Matematicas aplicadas 1
University
•15 Qs
LP2; Week 1 - A/R Guide
9th Grade
•20 Qs
Derivatives and Integrals to Know
11th - 12th Grade
•12 Qs
mid limit trigono
12th Grade
•13 Qs
Polygons & Angles
7th Grade
•20 Qs
FUNÇÃO DO 1º E 2º GRAU
10th - 11th Grade
•13 Qs

Rate and Graphs
Quiz
•
Mathematics
•
7th Grade
•
Practice Problem
•
Hard
+3
Standards-aligned

Anthony Clark
FREE Resource
Enhance your content in a minute
17 questions
Show all answers
1.
MULTIPLE CHOICE QUESTION
1 min • 1 pt

Which graph represents the data?


2.
MULTIPLE CHOICE QUESTION
1 min • 1 pt
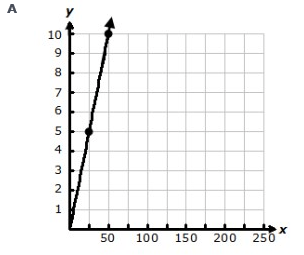
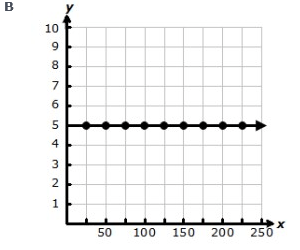
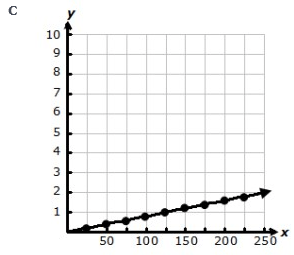
For every 125 pages Daysha reads, she earns 5 points. Which graph models this relationship?

Tags
CCSS.8.EE.B.5
3.
MULTIPLE CHOICE QUESTION
1 min • 1 pt
Trishtohn charges $17.50 for 5 roses. Which graph shows this relationship?
Tags
CCSS.8.EE.B.5
4.
MULTIPLE CHOICE QUESTION
1 min • 1 pt

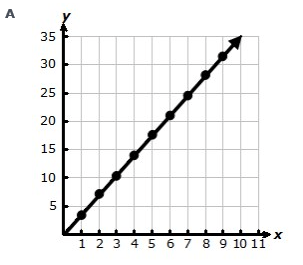
Find the slope of the line.
-5/4
5/4
-4/5
4/5
Tags
CCSS.8.EE.B.5
5.
MULTIPLE CHOICE QUESTION
1 min • 1 pt

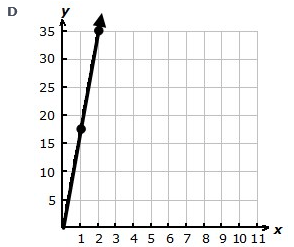
Find the slope of the line.
Undefined
0
1
-1
Tags
CCSS.8.EE.B.5
6.
MULTIPLE CHOICE QUESTION
1 min • 1 pt

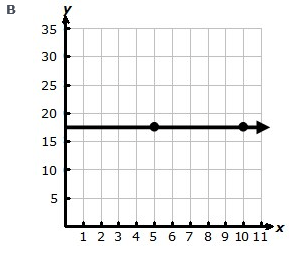
Find the slope of the line.
Undefined
0
1
-1
Tags
CCSS.8.EE.B.5
7.
MULTIPLE CHOICE QUESTION
1 min • 1 pt

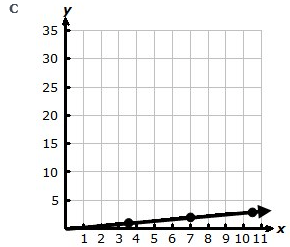
What is the rate of change?
$2/1 mile drive
$1/2 miles driven
2 miles driven/$1
1 mile driven/$2
Tags
CCSS.HSF.IF.B.4


Access all questions and much more by creating a free account
Create resources
Host any resource
Get auto-graded reports
Continue with Google

Continue with Email
Continue with Classlink
Continue with Clever
or continue with
Microsoft
%20(1).png)
Apple
Others
Already have an account?
Similar Resources on Wayground
19 questions
ميل المستقيمات المتعامدة والمتوازية
Quiz
•
8th - 10th Grade
15 questions
Operaciones con matrices
Quiz
•
12th Grade
15 questions
المستطيل - رياضيات 2
Quiz
•
3rd - 12th Grade
16 questions
Stratégies de calcul mental
Quiz
•
7th - 12th Grade
15 questions
N-tá mocnina deseti
Quiz
•
8th - 9th Grade
12 questions
ทบทวน เรื่อง เศษส่วน ม.1
Quiz
•
6th - 8th Grade
20 questions
PTS MATEMATIKA KELAS XI SEM GENAP
Quiz
•
11th Grade
20 questions
trigonometri
Quiz
•
9th - 12th Grade
Popular Resources on Wayground
7 questions
History of Valentine's Day
Interactive video
•
4th Grade
15 questions
Fractions on a Number Line
Quiz
•
3rd Grade
20 questions
Equivalent Fractions
Quiz
•
3rd Grade
25 questions
Multiplication Facts
Quiz
•
5th Grade
22 questions
fractions
Quiz
•
3rd Grade
15 questions
Valentine's Day Trivia
Quiz
•
3rd Grade
20 questions
Main Idea and Details
Quiz
•
5th Grade
20 questions
Context Clues
Quiz
•
6th Grade
Discover more resources for Mathematics
14 questions
Volume of rectangular prisms
Quiz
•
7th Grade
20 questions
Graphing Inequalities on a Number Line
Quiz
•
6th - 9th Grade
16 questions
2022 Winter Olympics Medal Table
Passage
•
6th - 8th Grade
12 questions
Add, Subtract, Multiply and divide integers
Quiz
•
7th Grade
20 questions
One Step equations addition and subtraction
Quiz
•
5th - 8th Grade
15 questions
Complementary, Supplementary, Vertical, Adjacent Angles
Quiz
•
7th Grade
15 questions
Area and Circumference of a Circle
Quiz
•
7th Grade
20 questions
Complementary, Supplementary, and Vertical Angles
Quiz
•
7th Grade