
Graphing Ratio Relationships
7th Grade
•20 Qs

Similar activities
Mental Math term2
7th - 8th Grade
•15 Qs
2nd Summative Test in Math 8
8th Grade
•15 Qs
Performance Test #1 Circles and Conic Section
10th - 11th Grade
•15 Qs
Adding and subtracting polynomials
9th Grade - University
•15 Qs
Grade IX Assessment
9th Grade
•15 Qs
Arithmetic Sequence
10th Grade
•15 Qs
Comparing Percentages
7th Grade
•15 Qs
Finding Slope
8th - 9th Grade
•15 Qs

Graphing Ratio Relationships
Quiz
•
Mathematics
•
7th Grade
•
Practice Problem
•
Hard
+13
Standards-aligned

Anthony Clark
Used 1+ times
FREE Resource
Enhance your content in a minute
20 questions
Show all answers
1.
MULTIPLE CHOICE QUESTION
1 min • 1 pt

What is the ordered pair of Point E?
(4,7)
(3,7)
(7,4)
(7,3)
Tags
CCSS.5.G.A.1
2.
MULTIPLE CHOICE QUESTION
1 min • 1 pt

Erasers cost 5 cents each at the school store. The table shows this relationship. Choose the graph which displays the ordered pairs and describes the graph.


Tags
CCSS.5.OA.B.3
3.
MULTIPLE CHOICE QUESTION
1 min • 1 pt
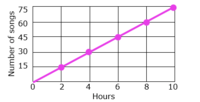
Based on the graph, how many songs would there be in 12 hours?
80 songs
15 songs
90 songs
65 songs
Tags
CCSS.HSF.LE.B.5
4.
MULTIPLE CHOICE QUESTION
1 min • 1 pt

In the fruit bowl there are 4 apples, 2 bananas, and 5 pears. What is the ratio of pears to ALL fruit?
5:4
5:11
2:5
6:5
Tags
CCSS.6.RP.A.1
CCSS.6.RP.A.2
5.
HOTSPOT QUESTION
1 min • 1 pt
A scenic train travels about 40 miles every hour. Generate the set of ordered pairs for the ratio relationship between the total distance traveled y and the number of hours x for a total of 1, 2, 3, and 4 hours. Then graph the relationship on the coordinate plane and describe the pattern in the graph.
Select the points on the coordinate plane that correctly graph this ratio relationship.
Tags
graphing
6.
HOTSPOT QUESTION
1 min • 1 pt
Ross is buying hats for his baseball team. Each package contains 4 hats. Generate the set of ordered pairs for the ratio relationship between the number of hats y and the number of packages x for a total of 1, 2, 3, and 4 packages.
Select the points on the coordinate plane that correctly graph this ratio relationship.
Tags
graphing
7.
MULTIPLE SELECT QUESTION
1 min • 1 pt

Choose ALL CORRECT statements.
*There may be more than 1.
The graph represents the ratio of weight per pound to cost.
At a weight of 8 pounds the cost is about $10.
The unit rate is $4 per pound.
At 9 pounds, the cost will be between $8 and $9.
Tags
CCSS.Math.Content.7.RP.A.1


Access all questions and much more by creating a free account
Create resources
Host any resource
Get auto-graded reports
Continue with Google

Continue with Email
Continue with Classlink
Continue with Clever
or continue with
Microsoft
%20(1).png)
Apple
Others
Already have an account?
Similar Resources on Wayground
22 questions
Similar Polygons Review
Quiz
•
6th - 7th Grade
20 questions
Central Limit Theorem for Sums
Quiz
•
11th - 12th Grade
15 questions
Area of Kites, Rhombuses, and Trapeziums
Quiz
•
7th - 8th Grade
20 questions
Arithmetic and Geometric Sequence Practice
Quiz
•
8th - 9th Grade
16 questions
EM Graphs of Power Function
Quiz
•
7th Grade
20 questions
numeri relativi moltiplicazione
Quiz
•
7th Grade
15 questions
Grade 11-12 Elimination
Quiz
•
9th - 10th Grade
20 questions
Vectors
Quiz
•
10th Grade
Popular Resources on Wayground
15 questions
Fractions on a Number Line
Quiz
•
3rd Grade
20 questions
Equivalent Fractions
Quiz
•
3rd Grade
25 questions
Multiplication Facts
Quiz
•
5th Grade
54 questions
Analyzing Line Graphs & Tables
Quiz
•
4th Grade
22 questions
fractions
Quiz
•
3rd Grade
20 questions
Main Idea and Details
Quiz
•
5th Grade
20 questions
Context Clues
Quiz
•
6th Grade
15 questions
Equivalent Fractions
Quiz
•
4th Grade
Discover more resources for Mathematics
22 questions
distributive property
Quiz
•
7th Grade
18 questions
Angle Relationships
Quiz
•
7th Grade
20 questions
How Some Friendships Last — and Others Don’t Video Questions
Quiz
•
7th Grade
18 questions
Handbook Refresher Quiz
Quiz
•
7th Grade
20 questions
Graphing Inequalities on a Number Line
Quiz
•
6th - 9th Grade
20 questions
graphing inequalities
Quiz
•
6th - 7th Grade
16 questions
Adding and Subtracting Integers
Quiz
•
7th Grade
20 questions
Angles: Complementary/Supplementary/ Vertical/ Adjacent
Quiz
•
7th Grade