
Graphing Rational Functions
11th Grade
•15 Qs

Similar activities
Online Maths Quiz
10th Grade - University
•10 Qs
Matriks
11th Grade
•10 Qs
eLearning - Inequality Practice
9th - 12th Grade
•15 Qs
math
7th Grade - University
•11 Qs
Réduction d'expressions littérales
7th Grade - University
•20 Qs
Introdução a Geometria Analítica
11th Grade
•10 Qs
CLASS-IX MATHS
9th - 12th Grade
•10 Qs
Himpunan 7a
11th - 12th Grade
•10 Qs

Graphing Rational Functions
Quiz
•
Mathematics
•
11th Grade
•
Practice Problem
•
Hard
+1
Standards-aligned

Anthony Clark
FREE Resource
Enhance your content in a minute
15 questions
Show all answers
1.
MULTIPLE CHOICE QUESTION
1 min • 1 pt

What are the asymptotes?
x = -3 y = 1
x = 3 y = 1
x = -3 y = -1
x = 3 y = -1
Tags
CCSS.HSF-IF.C.7D
2.
MULTIPLE CHOICE QUESTION
1 min • 1 pt

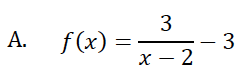
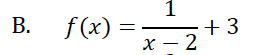
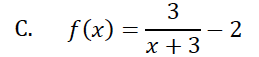
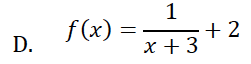
what is the equation that best matches the graph?
A
B
C
D
Tags
CCSS.HSF-IF.C.7D
3.
MULTIPLE CHOICE QUESTION
1 min • 1 pt

What is the domain and range?
D : All real number x ≠ -3
R: All real number y≠ 1
D : All real number x ≠ 1
R: All real number y≠ -3
D : All real number x ≠ 3
R: All real number y≠ 1
D : All real number x ≠ -1
R: All real number y≠ 3
Tags
CCSS.8.F.A.1
CCSS.HSF.IF.B.5
4.
MULTIPLE CHOICE QUESTION
1 min • 1 pt

What are the asymptotes?
x=-2 and y=-1
x=-2 and y=1
x=2 and y=1
x=2 and y = -1
Tags
CCSS.HSF-IF.C.7D
5.
MULTIPLE CHOICE QUESTION
1 min • 1 pt

What is the horizontal asymptote?
x = 2
x = 7
y = 2
y = 7
Tags
CCSS.HSF-IF.C.7D
6.
MULTIPLE CHOICE QUESTION
1 min • 1 pt

The given graphed function would have a horizontal asymptote at
x = 0
y = 0
x = 2
y = 2
Tags
CCSS.HSF-IF.C.7D
7.
MULTIPLE CHOICE QUESTION
1 min • 1 pt

Which of the following represents the graph below?
Tags
CCSS.HSF-IF.C.7D


Access all questions and much more by creating a free account
Create resources
Host any resource
Get auto-graded reports
Continue with Google

Continue with Email
Continue with Classlink
Continue with Clever
or continue with
Microsoft
%20(1).png)
Apple
Others
Already have an account?
Similar Resources on Wayground
10 questions
MATEMATIK SPM : Poligon
Quiz
•
1st - 12th Grade
12 questions
Unit 7 Multiplication and Division Review
Quiz
•
3rd Grade - University
10 questions
Ch 1 Introduction (Statistics)Class 11 Economics
Quiz
•
11th - 12th Grade
15 questions
Calculo Integral (1er Parcial)
Quiz
•
11th - 12th Grade
19 questions
REVISION: DATA DESCRIPTION
Quiz
•
11th Grade
10 questions
MAEC - DIAGNÓSTICO
Quiz
•
11th Grade
10 questions
HITUNG CEPAT
Quiz
•
9th - 12th Grade
10 questions
Circle
Quiz
•
11th Grade
Popular Resources on Wayground
15 questions
Fractions on a Number Line
Quiz
•
3rd Grade
20 questions
Equivalent Fractions
Quiz
•
3rd Grade
25 questions
Multiplication Facts
Quiz
•
5th Grade
54 questions
Analyzing Line Graphs & Tables
Quiz
•
4th Grade
22 questions
fractions
Quiz
•
3rd Grade
20 questions
Main Idea and Details
Quiz
•
5th Grade
20 questions
Context Clues
Quiz
•
6th Grade
15 questions
Equivalent Fractions
Quiz
•
4th Grade
Discover more resources for Mathematics
12 questions
Add and Subtract Polynomials
Quiz
•
9th - 12th Grade
15 questions
Exponential Growth and Decay Word Problems Practice
Quiz
•
9th - 12th Grade
20 questions
Classifying Polynomials by Degree and Number of Terms
Quiz
•
11th Grade
17 questions
Explore Experimental and Theoretical Probability
Quiz
•
7th - 12th Grade
15 questions
Parallelogram Properties
Quiz
•
10th - 12th Grade
10 questions
Special Right Triangles
Quiz
•
11th Grade
18 questions
Solving Systems- Word Problems
Quiz
•
9th - 12th Grade
34 questions
7.4 Review Cubic and Cube Root Functions
Quiz
•
10th - 12th Grade