Graphing Lines and Tables

Graphing Lines and Tables

9th Grade

15 Qs

quiz-placeholder

Similar activities

Linear Equations in Two Variables grade 9

Linear Equations in Two Variables grade 9

9th Grade

10 Qs

X and Y intercepts

X and Y intercepts

7th - 9th Grade

10 Qs

6.1 Quizizz

6.1 Quizizz

9th - 12th Grade

20 Qs

x & y intercepts

x & y intercepts

8th - 9th Grade

15 Qs

Exponential Graphs

Exponential Graphs

9th Grade

17 Qs

Exponential Functions  - Graphs & Tables

Exponential Functions - Graphs & Tables

9th Grade

20 Qs

Linear Equation in Two Variables (Assg. 1))

Linear Equation in Two Variables (Assg. 1))

9th Grade

20 Qs

Linear equation in two variables clas9

Linear equation in two variables clas9

9th Grade

19 Qs

Graphing Lines and Tables

Graphing Lines and Tables

Assessment

Quiz

Mathematics

9th Grade

Hard

Created by

Anthony Clark

FREE Resource

15 questions

Show all answers

1.

MULTIPLE CHOICE QUESTION

1 min • 1 pt

Write this information on your note page, then answer the question!

Linear Functions can be written in the form y = mx + b.

They can have positive or negative slopes and positive or negative y-intercepts.

Variables in the equation cannot contain exponents. There cannot be a variable in the denominator of any fraction in the equation.

Which equation represents a linear function?

2.

MULTIPLE CHOICE QUESTION

1 min • 1 pt

Media Image

To write an equation you need two pieces of information- the slope (m--the change in y over the change in x) and the y-intercept (b--where the line crosses the y-axis). Write an equation for the following linear function graphed on the left. Hint: use y = mx + b

Answer explanation

The line goes down, so the slope is negative.

2 down and over 3.

The line crosses the y-axis at positive 5, so the y-intercept is + 5.

3.

MULTIPLE CHOICE QUESTION

1 min • 1 pt

3

1/3

6

-6

4.

MULTIPLE CHOICE QUESTION

1 min • 1 pt

Media Image

The relations shown on the left are all linear functions.

Which one(s) have graphs that are lines going up and to the right?

ii and iv

i and iii

iii

i, iii, and iv

5.

MULTIPLE CHOICE QUESTION

1 min • 9 pts

Media Image

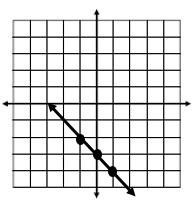
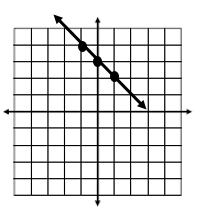
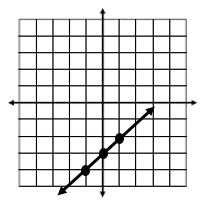
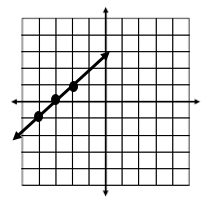
Which graph represents the table?

Media Image
Media Image
Media Image
Media Image

6.

MULTIPLE CHOICE QUESTION

1 min • 9 pts

Media Image

Which graph represents the table?

Media Image
Media Image
Media Image
Media Image

7.

FILL IN THE BLANK QUESTION

1 min • 9 pts

Media Image

Find the missing y value.

Create a free account and access millions of resources

Create resources
Host any resource
Get auto-graded reports
or continue with
Microsoft
Apple
Others
By signing up, you agree to our Terms of Service & Privacy Policy
Already have an account?