Representations of a Line
Quiz
•
Mathematics
•
8th Grade
•
Hard
+6
Standards-aligned

Anthony Clark
FREE Resource
16 questions
Show all answers
1.
MULTIPLE CHOICE QUESTION
1 min • 1 pt
Which is false about linear function?
Its graph is a line
It is a one-to-one relationship
In linear function, for every x there is only one y
The only way to represent a linear function is through a graph.
Tags
CCSS.8.F.B.4
CCSS.HSF.LE.A.2
2.
MULTIPLE CHOICE QUESTION
1 min • 1 pt

Which table represents the relationship in the graph above?


Tags
CCSS.HSF-LE.A.1B
3.
MULTIPLE CHOICE QUESTION
1 min • 1 pt

Which equation matches the table?
y = x + 4
y = 5x
y = x - 4
y = x + 16
Tags
CCSS.8.F.B.4
CCSS.HSF.LE.A.2
4.
MULTIPLE CHOICE QUESTION
1 min • 1 pt

What is the rate of change (m) for the table?
m = 90
m = 18
m = 1/9
m = 9
Tags
CCSS.8.F.B.4
CCSS.HSF.IF.B.6
5.
MULTIPLE CHOICE QUESTION
1 min • 1 pt

What inequality does the number line graph represent?
x >= 3
x > 3
x < -3
x <= 3
Tags
CCSS.6.EE.B.8
6.
MULTIPLE CHOICE QUESTION
1 min • 1 pt

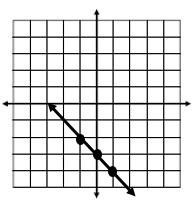
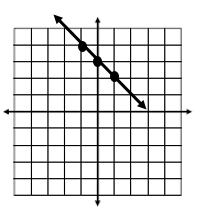
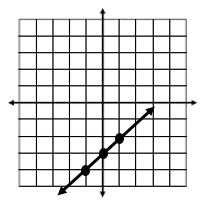
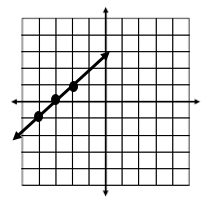
Which graph represents the table?


Tags
CCSS.8.EE.B.5
7.
MULTIPLE CHOICE QUESTION
1 min • 1 pt

Write an equation for this situation.
y=9.75x
y=x + 19.25
y=19.25x
y=9.5x
Tags
CCSS.8.F.B.4
CCSS.HSF.LE.A.2
Create a free account and access millions of resources
Similar Resources on Wayground

11 questions
Graphing Linear Equations
Quiz
•
9th - 10th Grade

17 questions
Linear Function Review
Quiz
•
8th - 11th Grade

16 questions
Graphing Inequalities on the Coordinate Plane
Quiz
•
9th - 10th Grade

21 questions
Graphing Slope Intercept Form
Quiz
•
8th - 9th Grade

11 questions
Graphing Systems of Equations & Inequalities
Quiz
•
9th Grade

18 questions
Algebra 1-1 Final Review
Quiz
•
9th - 12th Grade

18 questions
X and y intercepts
Quiz
•
8th - 10th Grade

18 questions
Chapter 3 Practice Test
Quiz
•
9th - 12th Grade
Popular Resources on Wayground

10 questions
Video Games
Quiz
•
6th - 12th Grade

20 questions
Brand Labels
Quiz
•
5th - 12th Grade

15 questions
Core 4 of Customer Service - Student Edition
Quiz
•
6th - 8th Grade

15 questions
What is Bullying?- Bullying Lesson Series 6-12
Lesson
•
11th Grade

25 questions
Multiplication Facts
Quiz
•
5th Grade

15 questions
Subtracting Integers
Quiz
•
7th Grade

22 questions
Adding Integers
Quiz
•
6th Grade

10 questions
Exploring Digital Citizenship Essentials
Interactive video
•
6th - 10th Grade
Discover more resources for Mathematics

10 questions
Parallel Lines Cut by a Transversal
Quiz
•
8th Grade

15 questions
Solving Multi-step Equations with Variables on Both Sides
Quiz
•
8th Grade

24 questions
3.1 Parallel lines cut by a transversal
Quiz
•
8th Grade

20 questions
Slope from a Graph
Quiz
•
8th Grade

16 questions
Parallel lines cut by a transversal vocabulary
Quiz
•
8th Grade

20 questions
Parallel Lines Cut by a Transversal
Quiz
•
8th Grade

20 questions
Combining Like Terms
Quiz
•
7th - 8th Grade

20 questions
Rational and Irrational Numbers
Quiz
•
8th Grade


