Functions Interpreting
Quiz
•
Mathematics
•
9th Grade
•
Practice Problem
•
Hard
+8
Standards-aligned

Anthony Clark
FREE Resource
Enhance your content in a minute
20 questions
Show all answers
1.
MULTIPLE CHOICE QUESTION
1 min • 1 pt

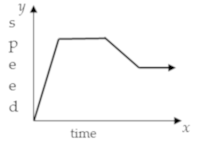
List the types of intervals that the graph demonstrates in order.
decreasing, constant, increasing, constant
increasing, decreasing, constant
increasing, constant, increasing, constant
increasing, constant, decreasing, constant
Tags
CCSS.HSF.IF.B.4
2.
MULTIPLE CHOICE QUESTION
1 min • 1 pt

Which statement is true about this function?
The function is never constant
The function is always increasing
The function is never decreasing
The function increases at the same rate between the interval x=11:00 and x=13:00
Tags
CCSS.HSF.IF.B.4
3.
MULTIPLE CHOICE QUESTION
1 min • 1 pt

What does the point (2, 4) represent?
On day 2, you got 4 facts correct.
You got 2 facts correct on day 4.
You got a total of 6 facts correct.
On day 3, you got 12 facts correct.
Tags
CCSS.HSF.IF.B.4
4.
MULTIPLE CHOICE QUESTION
1 min • 1 pt

What is the meaning of the y-intercept?
The weight in the bucket increases by 1 pound per pound of sand.
Before sand is put in the bucket, it weighs 1 pound.
The starting weight of the sand is 1 pound.
The weight in the bucket decreases by 1 pound per pound of sand.
Tags
CCSS.HSF.LE.B.5
5.
MULTIPLE CHOICE QUESTION
1 min • 1 pt

Tags
CCSS.8.F.A.1
CCSS.HSF.IF.A.1
6.
MULTIPLE CHOICE QUESTION
1 min • 1 pt

What type of association does this graph have?
positive
negative
none
all of the above
7.
MULTIPLE CHOICE QUESTION
1 min • 1 pt

The graph shows the height (cm) of a candle as it burns, what does the y-intercept mean?
Candle starts at 9 cm.
Candle start at 4.5 cm
Candle starts at 0 cm.
The candle ends at 5 cm
Tags
CCSS.HSF.LE.B.5
Access all questions and much more by creating a free account
Create resources
Host any resource
Get auto-graded reports

Continue with Google

Continue with Email

Continue with Classlink

Continue with Clever
or continue with

Microsoft
%20(1).png)
Apple
Others
Already have an account?
Similar Resources on Wayground

15 questions
Quiz on module-03
Quiz
•
University

20 questions
Pythagorean Theorem Practice
Quiz
•
7th - 9th Grade

19 questions
REVISION: DATA DESCRIPTION
Quiz
•
11th Grade

20 questions
Basic Math (M32102)
Quiz
•
10th - 11th Grade

20 questions
G12_Math+for+Bus+Eco_Term+Exam_Mock+Test
Quiz
•
12th Grade

15 questions
QUARTER 3_WEEK 5 PROBLEMS INVOLVING PERMUTATIONS AND COMBINATION
Quiz
•
10th Grade

20 questions
Números inteiros
Quiz
•
7th Grade - University

16 questions
Perimeter Recap - Inc. Circles!
Quiz
•
6th - 12th Grade
Popular Resources on Wayground

15 questions
Fractions on a Number Line
Quiz
•
3rd Grade

20 questions
Equivalent Fractions
Quiz
•
3rd Grade

25 questions
Multiplication Facts
Quiz
•
5th Grade

54 questions
Analyzing Line Graphs & Tables
Quiz
•
4th Grade

22 questions
fractions
Quiz
•
3rd Grade

20 questions
Main Idea and Details
Quiz
•
5th Grade

20 questions
Context Clues
Quiz
•
6th Grade

15 questions
Equivalent Fractions
Quiz
•
4th Grade
Discover more resources for Mathematics

20 questions
Graphing Inequalities on a Number Line
Quiz
•
6th - 9th Grade

18 questions
SAT Prep: Ratios, Proportions, & Percents
Quiz
•
9th - 10th Grade

12 questions
Exponential Growth and Decay
Quiz
•
9th Grade

12 questions
Add and Subtract Polynomials
Quiz
•
9th - 12th Grade

15 questions
Combine Like Terms and Distributive Property
Quiz
•
8th - 9th Grade

20 questions
Function or Not a Function
Quiz
•
8th - 9th Grade

10 questions
Elijah McCoy: Innovations and Impact in Black History
Interactive video
•
6th - 10th Grade

16 questions
Converting Improper Fractions to Mixed Numbers
Quiz
•
4th - 10th Grade


