Graphing a Function Intervals
Authored by Anthony Clark
Mathematics
11th Grade
CCSS covered

AI Actions
Add similar questions
Adjust reading levels
Convert to real-world scenario
Translate activity
More...
Content View
Student View
14 questions
Show all answers
1.
MULTIPLE CHOICE QUESTION
1 min • 1 pt


Tags
CCSS.HSF-IF.C.7B
2.
MULTIPLE CHOICE QUESTION
1 min • 1 pt

What is the domain for the Linear Piece of f(x)?
Not enough information given
Tags
CCSS.HSF-IF.C.7B
3.
MULTIPLE CHOICE QUESTION
1 min • 1 pt
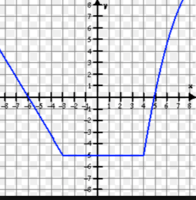
Over what interval is this function constant?
-5 < x < ∞
-3 < x < 4
4 < x < ∞
-5
Tags
CCSS.HSF-IF.C.7B
4.
DROPDOWN QUESTION
1 min • 2 pts
For a given piecewise-defined function, the pieces of the function are defined for intervals of the domain, x≤−1 and x>−1.
Explain how you could find the y-intercept for the function over the intervals x≤−1 and x>−1?
The y-intercept is included in the piece of the function that crosses the (a) The piece for the interval (b)
y-axis
x-axis
x>-1
x≤-1
Tags
CCSS.HSF-IF.C.7B
5.
MULTIPLE CHOICE QUESTION
1 min • 1 pt

Match the graph with the correct equation.


Tags
CCSS.HSF-IF.C.7B
6.
MULTIPLE CHOICE QUESTION
1 min • 1 pt

This is an example of a
discrete linear function
discrete scatterplot
discrete step function
Tags
CCSS.HSF-IF.C.7B
7.
MULTIPLE SELECT QUESTION
1 min • 1 pt

Which of the following represent intervals of decrease for the function graphed?


Access all questions and much more by creating a free account
Create resources
Host any resource
Get auto-graded reports
Continue with Google

Continue with Email
Continue with Classlink
Continue with Clever
or continue with
Microsoft
%20(1).png)
Apple
Others
Already have an account?
Similar Resources on Wayground

15 questions
Set Notations
Quiz
•
12th Grade
14 questions
Math 12 Essentials - Word Problems Adding and Subtracting
Quiz
•
12th Grade
10 questions
DBM20023 Exponential Differentiation
Quiz
•
University
10 questions
Matriks Quiz
Quiz
•
11th Grade
10 questions
Latihan soal KSN matematika SD
Quiz
•
5th - 12th Grade
17 questions
Quadratic Equations: Standard Form
Quiz
•
10th - 11th Grade
11 questions
Tablas del 6 y 7
Quiz
•
1st - 12th Grade
15 questions
Multiplying powers
Quiz
•
8th - 11th Grade
Popular Resources on Wayground
15 questions
Fractions on a Number Line
Quiz
•
3rd Grade
20 questions
Equivalent Fractions
Quiz
•
3rd Grade
25 questions
Multiplication Facts
Quiz
•
5th Grade
22 questions
fractions
Quiz
•
3rd Grade
20 questions
Main Idea and Details
Quiz
•
5th Grade
20 questions
Context Clues
Quiz
•
6th Grade
15 questions
Equivalent Fractions
Quiz
•
4th Grade
20 questions
Figurative Language Review
Quiz
•
6th Grade
Discover more resources for Mathematics
12 questions
Add and Subtract Polynomials
Quiz
•
9th - 12th Grade
13 questions
Model Exponential Growth and Decay Scenarios
Quiz
•
9th - 12th Grade
27 questions
7.2.3 Quadrilateral Properties
Quiz
•
9th - 12th Grade
10 questions
Key Features of Quadratic Functions
Interactive video
•
8th - 12th Grade
11 questions
Exponent Quotient Rules A1 U7
Quiz
•
9th - 12th Grade
18 questions
Integer Operations
Quiz
•
5th - 12th Grade
15 questions
Exponential Growth and Decay Word Problems
Quiz
•
9th - 12th Grade
10 questions
complementary and Supplementary angles
Quiz
•
9th - 12th Grade