Evaluate Functions Using a Graph
Authored by Anthony Clark
Mathematics
11th Grade
CCSS covered

AI Actions
Add similar questions
Adjust reading levels
Convert to real-world scenario
Translate activity
More...
Content View
Student View
15 questions
Show all answers
1.
MULTIPLE CHOICE QUESTION
1 min • 1 pt

Using the graph, find the average rate of change at which this person was traveling.
80 miles per hour
40 miles per hour
20 miles per hour
160 miles per hour
Tags
CCSS.8.F.B.4
CCSS.HSF.IF.B.6
2.
MULTIPLE CHOICE QUESTION
1 min • 1 pt

Which line has the greatest average rate of change on the graph? Why?
Blue, it's average rate of change is $120 per month
Red, it's average rate of change is $40 per month
Blue, it's average rate of change is $160 per month
Red, it's average rate of change is $80 per month
Tags
CCSS.8.F.B.4
CCSS.HSF.IF.B.6
3.
MULTIPLE CHOICE QUESTION
1 min • 1 pt

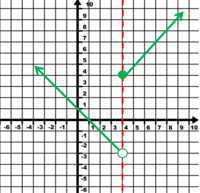
What is the domain of the pictured graph?
y cannot equal 2
x cannot equal 2
y cannot equal 0
x cannot equal 0
Tags
CCSS.8.F.A.1
CCSS.HSF.IF.B.5
4.
MULTIPLE CHOICE QUESTION
1 min • 1 pt

What is the domain of the pictured graph?
x<0
x>0
x<3
x>3
Tags
CCSS.8.F.A.1
CCSS.HSF.IF.B.5
5.
MULTIPLE CHOICE QUESTION
1 min • 1 pt

Is the table pictured a linear relationship? Why or Why not
Yes, it has a constant change
Yes, it does not have different rates of change
No, it has constant rate of change
No, it does not have a constant rate of change
Tags
CCSS.HSF-LE.A.1B
6.
MULTIPLE CHOICE QUESTION
1 min • 1 pt

What is the domain of the given function y=5x+10?
All real numbers except 5
x>10
All real numbers
y>10
Tags
CCSS.8.F.A.1
CCSS.HSF.IF.B.5
7.
MULTIPLE CHOICE QUESTION
1 min • 1 pt

1
2
3
4
Tags
CCSS.HSF-IF.C.7B


Access all questions and much more by creating a free account
Create resources
Host any resource
Get auto-graded reports
Continue with Google

Continue with Email
Continue with Classlink
Continue with Clever
or continue with
Microsoft
%20(1).png)
Apple
Others
Already have an account?
Similar Resources on Wayground

20 questions
Me divierto con las Matemáticas LILEGRE 8° y 9° 2020.
Quiz
•
1st Grade - University
20 questions
Thử thách Toán Tuần 11
Quiz
•
5th Grade - University
13 questions
ULANGAN HARIAN SEMESTER 1 MATEMATIKA PEMINATAN X MIPA
Quiz
•
12th Grade
10 questions
Limit Tak hingga 1
Quiz
•
12th Grade - University
15 questions
Year 10 Solving Equations
Quiz
•
9th - 11th Grade
11 questions
Medidas de almacenamiento
Quiz
•
11th Grade
15 questions
Unidad 2 - Probabilidad y Estadística
Quiz
•
University
10 questions
Interés simple
Quiz
•
University
Popular Resources on Wayground
15 questions
Fractions on a Number Line
Quiz
•
3rd Grade
20 questions
Equivalent Fractions
Quiz
•
3rd Grade
25 questions
Multiplication Facts
Quiz
•
5th Grade
22 questions
fractions
Quiz
•
3rd Grade
20 questions
Main Idea and Details
Quiz
•
5th Grade
20 questions
Context Clues
Quiz
•
6th Grade
15 questions
Equivalent Fractions
Quiz
•
4th Grade
20 questions
Figurative Language Review
Quiz
•
6th Grade
Discover more resources for Mathematics
12 questions
Add and Subtract Polynomials
Quiz
•
9th - 12th Grade
13 questions
Model Exponential Growth and Decay Scenarios
Quiz
•
9th - 12th Grade
27 questions
7.2.3 Quadrilateral Properties
Quiz
•
9th - 12th Grade
10 questions
Key Features of Quadratic Functions
Interactive video
•
8th - 12th Grade
11 questions
Exponent Quotient Rules A1 U7
Quiz
•
9th - 12th Grade
18 questions
Integer Operations
Quiz
•
5th - 12th Grade
15 questions
Exponential Growth and Decay Word Problems
Quiz
•
9th - 12th Grade
10 questions
complementary and Supplementary angles
Quiz
•
9th - 12th Grade