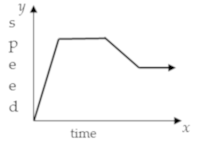
Function Relationship Graph Steady Increase Decrease Constant
Quiz
•
Mathematics
•
8th Grade
•
Practice Problem
•
Hard
Standards-aligned

Anthony Clark
FREE Resource
Enhance your content in a minute
14 questions
Show all answers
1.
MULTIPLE CHOICE QUESTION
1 min • 1 pt

What is happening at D?
Stationary
Accelerating
Fast steady speed; moving away from the starting position
Slower steady speed; moving away from the starting position
Tags
CCSS.8.EE.B.5
2.
MULTIPLE CHOICE QUESTION
1 min • 1 pt

At what time did runner A pass runner B?
0 seconds
1 second
2 seconds
3 seconds
Tags
CCSS.8.EE.B.5
3.
MULTIPLE CHOICE QUESTION
1 min • 1 pt

For 1-6 Match the verbal description with the part of the graph it describes.
1. Stays the same.
F
A
D
C
Tags
CCSS.HSF-IF.C.7B
4.
MULTIPLE CHOICE QUESTION
1 min • 1 pt

The distance-time graphs shown represent the motion of a car. Which of the following graphs represents the car at constant speed?
graph A
graph B
graph C
graph D
Tags
CCSS.8.EE.B.5
5.
MULTIPLE CHOICE QUESTION
1 min • 1 pt

Every morning, Tom walks along a straight road from his home to the bus stop. Below, is a graph representing Tom’s trip to school.
- What is the distance covered through the second segment, which is between 50 seconds, and 70 seconds?
40 meters
60 meters
80 meters
20 meters
Tags
CCSS.HSF.IF.B.4
6.
MULTIPLE CHOICE QUESTION
1 min • 1 pt

List the types of intervals that the graph demonstrates in order.
decreasing, constant, increasing, constant
increasing, decreasing, constant
increasing, constant, increasing, constant
increasing, constant, decreasing, constant
Tags
CCSS.HSF.IF.B.4
7.
MULTIPLE CHOICE QUESTION
1 min • 1 pt

Which statement is true about this function?
The function is never constant
The function is always increasing
The function is never decreasing
The function increases on the interval 11:00 < x < 15:00
Access all questions and much more by creating a free account
Create resources
Host any resource
Get auto-graded reports

Continue with Google

Continue with Email

Continue with Classlink

Continue with Clever
or continue with

Microsoft
%20(1).png)
Apple
Others
Already have an account?
Similar Resources on Wayground

15 questions
Equivalent Fraction
Quiz
•
5th Grade - University

14 questions
Y8 Exam Check - Ch6 Ratios and Rates
Quiz
•
8th Grade

11 questions
7th Q1 Benchmark Review
Quiz
•
7th Grade - University

10 questions
Introduction to Linear Inequalities in Two Variables
Quiz
•
8th Grade

10 questions
No Solution or All real numbers
Quiz
•
7th - 8th Grade

16 questions
Functions and Scatterplots Review
Quiz
•
8th Grade

10 questions
Coordinate Plane
Quiz
•
8th Grade

10 questions
CLT & Distributive Property
Quiz
•
8th Grade
Popular Resources on Wayground

15 questions
Fractions on a Number Line
Quiz
•
3rd Grade

20 questions
Equivalent Fractions
Quiz
•
3rd Grade

25 questions
Multiplication Facts
Quiz
•
5th Grade

22 questions
fractions
Quiz
•
3rd Grade

20 questions
Main Idea and Details
Quiz
•
5th Grade

20 questions
Context Clues
Quiz
•
6th Grade

15 questions
Equivalent Fractions
Quiz
•
4th Grade

20 questions
Figurative Language Review
Quiz
•
6th Grade
Discover more resources for Mathematics

15 questions
Product of Powers Property A1 U7
Quiz
•
8th Grade

20 questions
Laws of Exponents
Quiz
•
8th Grade

16 questions
8th U5L5 Graphs of Functions
Quiz
•
8th Grade

20 questions
Graphing Inequalities on a Number Line
Quiz
•
6th - 9th Grade

20 questions
Exponent Rules Review
Quiz
•
8th - 9th Grade

20 questions
One Step equations addition and subtraction
Quiz
•
5th - 8th Grade

20 questions
Translations
Quiz
•
8th Grade

25 questions
Complementary and Supplementary Angles
Quiz
•
7th - 10th Grade


