Graphing and Data
Authored by Anthony Clark
Mathematics
3rd Grade
CCSS covered
Used 3+ times

AI Actions
Add similar questions
Adjust reading levels
Convert to real-world scenario
Translate activity
More...
Content View
Student View
15 questions
Show all answers
1.
MULTIPLE CHOICE QUESTION
1 min • 1 pt

How many cones were sold in all?
16
21
11
33
Tags
CCSS.2.MD.D.9
2.
MULTIPLE CHOICE QUESTION
1 min • 1 pt

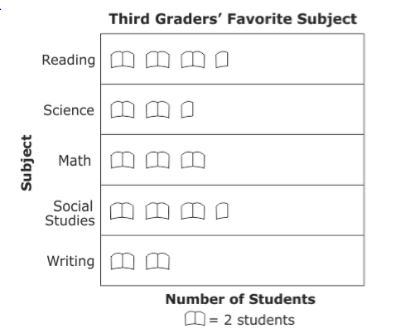
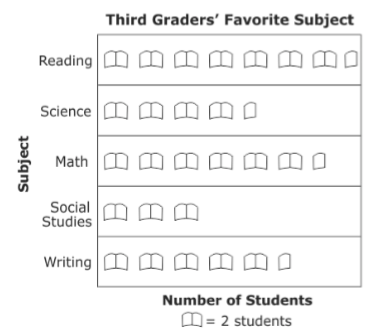
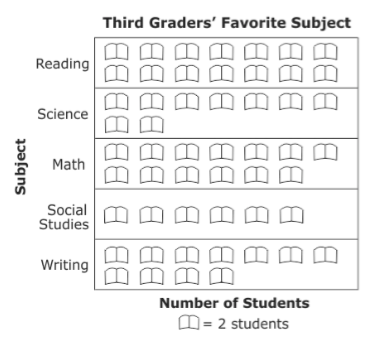
Students in 3rd grade collected data on their favorite subject and recorded it on the table shown. Which graph shows this information?


Tags
CCSS.2.MD.D.9
3.
MULTIPLE CHOICE QUESTION
1 min • 1 pt

How many kids wore walking shoes to school today?
7
10
9
6
Tags
CCSS.2.MD.D.9
4.
MULTIPLE CHOICE QUESTION
1 min • 1 pt

What was the most amount of candy bars a student had?
0
6
1
5
Tags
CCSS.2.MD.D.9
5.
MULTIPLE CHOICE QUESTION
1 min • 1 pt

How much money was earned on Friday?
$10.00
$15.00
$25.00
$35.00
6.
MULTIPLE CHOICE QUESTION
1 min • 1 pt

How many balloon animals did Landon make in all on Sunday?
15
140
150
160
7.
MULTIPLE CHOICE QUESTION
1 min • 1 pt

How many more people like the color purple than blue?
1
3
6
8
Access all questions and much more by creating a free account
Create resources
Host any resource
Get auto-graded reports

Continue with Google

Continue with Email

Continue with Classlink

Continue with Clever
or continue with

Microsoft
%20(1).png)
Apple
Others
Already have an account?
Similar Resources on Wayground

10 questions
LATIHAN SPLTV KELAS X M4TH WAJIB
Quiz
•
10th Grade

12 questions
لعبة الكسر كجزء من كمية
Quiz
•
4th Grade

13 questions
Znaky dělitelnosti 2
Quiz
•
6th - 9th Grade

10 questions
Simplification d'expressions
Quiz
•
8th Grade

10 questions
INDEX NUMBER
Quiz
•
12th Grade

20 questions
REPASO MATEMÁTICAS
Quiz
•
6th Grade

13 questions
Números Decimais e Probabilidade
Quiz
•
6th Grade

20 questions
Penilaian Harian Ke- 1 Materi Bilangan Berpangkat dan Bentuk Akar
Quiz
•
9th Grade
Popular Resources on Wayground

15 questions
Fractions on a Number Line
Quiz
•
3rd Grade

20 questions
Equivalent Fractions
Quiz
•
3rd Grade

25 questions
Multiplication Facts
Quiz
•
5th Grade

54 questions
Analyzing Line Graphs & Tables
Quiz
•
4th Grade

22 questions
fractions
Quiz
•
3rd Grade

20 questions
Main Idea and Details
Quiz
•
5th Grade

20 questions
Context Clues
Quiz
•
6th Grade

15 questions
Equivalent Fractions
Quiz
•
4th Grade
Discover more resources for Mathematics

15 questions
Fractions on a Number Line
Quiz
•
3rd Grade

20 questions
Equivalent Fractions
Quiz
•
3rd Grade

22 questions
fractions
Quiz
•
3rd Grade

18 questions
Comparing Fractions with same numerator or denominator
Quiz
•
3rd Grade

12 questions
Fractions on a numberline review
Quiz
•
3rd Grade

10 questions
Area
Quiz
•
3rd Grade

20 questions
Fractions
Quiz
•
3rd Grade

100 questions
100 multiplication facts
Quiz
•
3rd Grade

