
Intervals Quadratic
9th Grade
•14 Qs

Similar activities
9.6_Linear Transformation of data
9th - 10th Grade
•10 Qs
The Brain Quiz - Demo(Practice) Round (Carries No Value)
1st - 12th Grade
•10 Qs
FINDING QUADRATIC FUNCTION/EQUATION
9th Grade
•15 Qs
Class IX Quiz
8th - 9th Grade
•15 Qs
NATIONAL MATHEMATICS DAY
5th Grade - Professional Development
•10 Qs
G.13 & G.14
9th Grade - University
•10 Qs
9th chp 4 and 6 live
9th Grade
•13 Qs
Trinomials Quiz
8th - 10th Grade
•10 Qs

Intervals Quadratic
Quiz
•
Mathematics
•
9th Grade
•
Practice Problem
•
Medium
+3
Standards-aligned

Anthony Clark
Used 3+ times
FREE Resource
Enhance your content in a minute
14 questions
Show all answers
1.
MULTIPLE CHOICE QUESTION
1 min • 5 pts

Where is the function decreasing?
(-∞, -1)
(-1, ∞)
(-∞, 3)
(-∞, ∞)
Tags
CCSS.HSF-IF.C.7A
2.
MULTIPLE CHOICE QUESTION
1 min • 5 pts

Which answer choice best represents the domain and range of the function?
3.
MULTIPLE CHOICE QUESTION
1 min • 5 pts

What is the range of the graph?
All real numbers
Tags
AI.9.6.A
4.
MULTIPLE CHOICE QUESTION
1 min • 5 pts
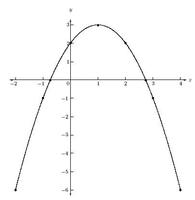
Describe the end behavior of the graph.
x →∞, y→⁻∞ and x →⁻∞,y→⁻∞
x →∞, y→∞ and x→⁻∞, y→∞
x →∞, y→∞ and x→⁻∞, y→0
x →∞,y→∞ and x→⁻∞, y→⁻∞
Tags
CCSS.HSF-IF.C.7A
5.
MULTIPLE CHOICE QUESTION
1 min • 5 pts

What is the range of the graph?
[1, ∞)
(1, ∞)
(-∞, ∞)
none of these
Tags
CCSS.8.F.A.1
CCSS.HSF.IF.B.5
6.
FILL IN THE BLANK QUESTION
1 min • 1 pt

On what interval is the graph of k concave down?
(type with no spaces)
7.
MULTIPLE CHOICE QUESTION
1 min • 1 pt

The table shows values for a function k at selected values of x. Which of the following claim and explanation statements best fit these data?
k is the best modeled by a linear function because the rate of change over consecutive equal-length input-value intervals is constant
k is the best modeled by a linear function because the rate of change over consecutive equal-length input-value intervals is linear
k is the best modeled by a quadratic function because the rate of change over consecutive equal-length input-value intervals is constant
k is the best modeled by a quadratic function because the rate of change over consecutive equal-length input-value intervals is linear. The rate of change is changing at a constant rate of -1


Access all questions and much more by creating a free account
Create resources
Host any resource
Get auto-graded reports
Continue with Google

Continue with Email
Continue with Classlink
Continue with Clever
or continue with
Microsoft
%20(1).png)
Apple
Others
Already have an account?
Similar Resources on Wayground
15 questions
Pythagorean Theorem Test
Quiz
•
8th - 9th Grade
10 questions
MGSE.7.G2 (Triangles)
Quiz
•
KG - University
10 questions
Square Roots
Quiz
•
9th Grade
10 questions
Find the measure of each angle.
Quiz
•
9th - 12th Grade
12 questions
Homework 3/18
Quiz
•
9th Grade
10 questions
Deductive Reasoning Homework
Quiz
•
9th - 10th Grade
12 questions
Mathematic Revision
Quiz
•
6th - 9th Grade
15 questions
KUASA TIGA DAN PUNCA KUASA TIGA
Quiz
•
7th - 9th Grade
Popular Resources on Wayground
15 questions
Fractions on a Number Line
Quiz
•
3rd Grade
20 questions
Equivalent Fractions
Quiz
•
3rd Grade
25 questions
Multiplication Facts
Quiz
•
5th Grade
54 questions
Analyzing Line Graphs & Tables
Quiz
•
4th Grade
22 questions
fractions
Quiz
•
3rd Grade
20 questions
Main Idea and Details
Quiz
•
5th Grade
20 questions
Context Clues
Quiz
•
6th Grade
15 questions
Equivalent Fractions
Quiz
•
4th Grade
Discover more resources for Mathematics
20 questions
Graphing Inequalities on a Number Line
Quiz
•
6th - 9th Grade
18 questions
SAT Prep: Ratios, Proportions, & Percents
Quiz
•
9th - 10th Grade
12 questions
Exponential Growth and Decay
Quiz
•
9th Grade
12 questions
Add and Subtract Polynomials
Quiz
•
9th - 12th Grade
15 questions
Combine Like Terms and Distributive Property
Quiz
•
8th - 9th Grade
20 questions
Function or Not a Function
Quiz
•
8th - 9th Grade
10 questions
Elijah McCoy: Innovations and Impact in Black History
Interactive video
•
6th - 10th Grade
16 questions
Converting Improper Fractions to Mixed Numbers
Quiz
•
4th - 10th Grade