Ratios, Ratio Tables and Graphing
Authored by Anthony Clark
Mathematics
6th Grade
CCSS covered
Used 3+ times

AI Actions
Add similar questions
Adjust reading levels
Convert to real-world scenario
Translate activity
More...
Content View
Student View
20 questions
Show all answers
1.
MULTIPLE CHOICE QUESTION
1 min • 1 pt

What is the missing value in the table?
$48
$52
$54
$60
2.
MULTIPLE CHOICE QUESTION
1 min • 1 pt
There were 5 ice cream cones for every 3 brownies sold at the ice cream shop. If there were 24 brownies sold, how many ice cream cones were sold?
8
15
40
29
Tags
CCSS.6.RP.A.3B
3.
MULTIPLE CHOICE QUESTION
1 min • 1 pt

Sam and Megan share Skittles in a ratio 4:1. If there are 75 Skittles in a large bag, how many do they each get?
75 and 0
40 and 35
20 and 55
60 and 15
4.
MULTIPLE CHOICE QUESTION
1 min • 1 pt

14 and 27
14 and 24
14 and 21
14 and 32
5.
MULTIPLE CHOICE QUESTION
1 min • 1 pt
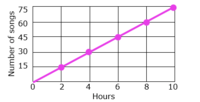
Based on the graph, how many songs would there be in 12 hours?
80 songs
15 songs
90 songs
65 songs
Tags
CCSS.5.OA.B.3
6.
MULTIPLE CHOICE QUESTION
1 min • 1 pt

Which equation would be use to create the graph above?
y = 50x
y = 2x
y = 0.02x
Tags
CCSS.8.EE.B.5
7.
MULTIPLE CHOICE QUESTION
1 min • 1 pt

Which of the following rates of change represents the graph shown?
2 boys for every 1 girl
0.5 boys for every 1 girl
6 boys for every 1 girl
3 boys for every 1 girl
Tags
CCSS.7.RP.A.2D


Access all questions and much more by creating a free account
Create resources
Host any resource
Get auto-graded reports
Continue with Google

Continue with Email
Continue with Classlink
Continue with Clever
or continue with
Microsoft
%20(1).png)
Apple
Others
Already have an account?
