- Resource Library
- Math
- Probability And Statistics
- Tree Diagrams
- Determine Probabilities Of Compound Events Using Organized Lists, Tables, Tree Diagrams, And Simulation
Determine Probabilities of Compound Events Using Organized Lists, Tables, Tree Diagrams, and Simulation
Authored by Barbara White
Mathematics
6th Grade
Used 1+ times

AI Actions
Add similar questions
Adjust reading levels
Convert to real-world scenario
Translate activity
More...
Content View
Student View
20 questions
Show all answers
1.
MULTIPLE CHOICE QUESTION
15 mins • 1 pt

The tree diagram shows the outcomes of rolling a die and flipping a coin.
How many total outcomes are there?
2.
MULTIPLE CHOICE QUESTION
15 mins • 1 pt
The tree diagram shows the outcomes of rolling a die and flipping a coin.
What is the probability of rolling an even number and flipping a head?
3.
MULTIPLE CHOICE QUESTION
15 mins • 1 pt

You have a 3 tops, 2 pants and 2 shoes. How many total outfit options are represented?
12 outfits
22 outfits
3 outfits
7 outfits
4.
MULTIPLE CHOICE QUESTION
15 mins • 1 pt
A Tree Diagram is
A written list of all possible outcomes
A description of all possible outcomes
A drawing with branches of all possible outcomes
5.
MULTIPLE CHOICE QUESTION
15 mins • 1 pt

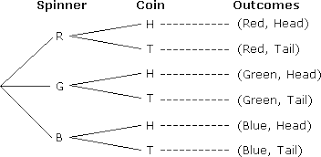
Use the tree diagram to find the probability of tossing a head first and then a tail when a coin is tossed twice.
1
1/2
1/4
1/8
6.
MULTIPLE CHOICE QUESTION
15 mins • 1 pt
A tree diagram is useful in determining the __________of a probability experiment.
result
possible outcomes
event
none of the above
7.
MULTIPLE CHOICE QUESTION
15 mins • 1 pt

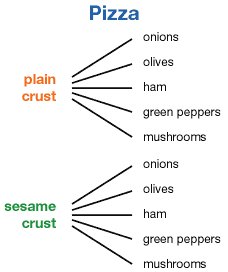
What is the probability that you will get plain crust with ham on your pizza?
1/8
1/2
1/10
2/10

Access all questions and much more by creating a free account
Create resources
Host any resource
Get auto-graded reports
Continue with Google

Continue with Email
Continue with Classlink
Continue with Clever
or continue with
Microsoft
%20(1).png)
Apple
Others
Already have an account?
