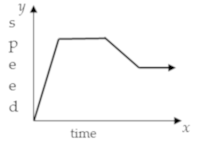
Function Relationship Graph Steady Increase Decrease Constant
Authored by Barbara White
Mathematics
8th Grade
CCSS covered

AI Actions
Add similar questions
Adjust reading levels
Convert to real-world scenario
Translate activity
More...
Content View
Student View
6 questions
Show all answers
1.
MULTIPLE CHOICE QUESTION
2 mins • 1 pt

List the types of intervals that the graph demonstrates in order.
Tags
CCSS.HSF.IF.B.4
2.
MULTIPLE CHOICE QUESTION
2 mins • 1 pt

Which statement is true about this function?
3.
MULTIPLE CHOICE QUESTION
2 mins • 1 pt
An airplane takes off from an airport, flies at a steady height for a short period of time, then descends and lands back at the airport.
Which graph best represents this situation?


Tags
CCSS.HSF-IF.C.7B
4.
MULTIPLE CHOICE QUESTION
2 mins • 1 pt

Describe the situation.
Sales decrease quickly, and then increase slowly
Sales stay constant, then decrease at a rapid rate, and finally increase slowly.
Tags
CCSS.HSF.IF.B.4
5.
MULTIPLE CHOICE QUESTION
2 mins • 1 pt
Jenny removes the plug from a bathtub holding about 200 liters of water. The faucet is off, and the water begins draining at a constant rate. After 2.5 minutes, she puts the plug back for about 1 minute. Then, Jenny removes the plug again. The water starts draining again and it takes about 1.5 minutes to empty the tub. Which graph represents the water in the tub over time as Jenny drains it?


6.
MULTIPLE CHOICE QUESTION
2 mins • 1 pt

What is happening in this graph from point B to C?
The object is going down a hill.
The object is returning to its starting location.
The object is slowing down.
The object is staying still.
Tags
CCSS.HSF.IF.B.4
Access all questions and much more by creating a free account
Create resources
Host any resource
Get auto-graded reports

Continue with Google

Continue with Email

Continue with Classlink

Continue with Clever
or continue with

Microsoft
%20(1).png)
Apple
Others
Already have an account?
Similar Resources on Wayground

10 questions
Side – Angle Inequality Theorem
Quiz
•
8th - 12th Grade

10 questions
Activity: Rational Algebraic Expressions
Quiz
•
8th Grade

9 questions
Mod min median
Quiz
•
6th - 8th Grade

10 questions
Slope from Table and Points
Quiz
•
8th Grade - University

10 questions
HINGES THEOREM
Quiz
•
8th Grade

11 questions
Fact Practice Multiplication and Division
Quiz
•
5th Grade - University

10 questions
Perpendicular Bisector
Quiz
•
8th - 10th Grade

10 questions
Triangular Prism
Quiz
•
8th - 9th Grade
Popular Resources on Wayground

15 questions
Fractions on a Number Line
Quiz
•
3rd Grade

20 questions
Equivalent Fractions
Quiz
•
3rd Grade

25 questions
Multiplication Facts
Quiz
•
5th Grade

22 questions
fractions
Quiz
•
3rd Grade

20 questions
Main Idea and Details
Quiz
•
5th Grade

20 questions
Context Clues
Quiz
•
6th Grade

15 questions
Equivalent Fractions
Quiz
•
4th Grade

20 questions
Figurative Language Review
Quiz
•
6th Grade
Discover more resources for Mathematics

15 questions
Product of Powers Property A1 U7
Quiz
•
8th Grade

20 questions
Laws of Exponents
Quiz
•
8th Grade

16 questions
8th U5L5 Graphs of Functions
Quiz
•
8th Grade

20 questions
Graphing Inequalities on a Number Line
Quiz
•
6th - 9th Grade

20 questions
Exponent Rules Review
Quiz
•
8th - 9th Grade

20 questions
One Step equations addition and subtraction
Quiz
•
5th - 8th Grade

20 questions
Translations
Quiz
•
8th Grade

25 questions
Complementary and Supplementary Angles
Quiz
•
7th - 10th Grade