
Graphing Ratio Tables
6th Grade
•20 Qs

Similar activities
FS MATHS LEVEL 1 EXAM Revision SAM Set 2 - Part 1
6th Grade
•16 Qs
KELILING DAN LUAS LINGKARAN
6th Grade
•20 Qs
MATEMATICAS. TRIMESTRE 1
1st - 10th Grade
•20 Qs
Ulangan Harian Tema 1 ST 1 Kelas 6
6th Grade
•20 Qs
evaluacion logaritmos
5th - 8th Grade
•20 Qs
NÚMEROS PRIMOS Y COMPUESTOS Y CRITERIO DE DIVISIBILIDAD
5th - 6th Grade
•18 Qs
REPASO MATEMÁTICAS
6th Grade
•20 Qs
Matemáticate
5th - 6th Grade
•16 Qs

Graphing Ratio Tables
Quiz
•
Mathematics
•
6th Grade
•
Hard
+7
Standards-aligned

Aurora Proo
Used 9+ times
FREE Resource
Enhance your content in a minute
20 questions
Show all answers
1.
MULTIPLE CHOICE QUESTION
45 sec • 1 pt

A car wash can wash four cars in one hour. The table shows the total number of cars washed in 0, 1, 2, and 3 hours.
Which graph represents the ordered pairs and describes the graph.


Tags
CCSS.5.OA.B.3
2.
MULTIPLE CHOICE QUESTION
45 sec • 1 pt

Erasers cost 5 cents each at the school store. The table shows this relationship. Choose the graph which displays the ordered pairs and describes the graph.


Tags
CCSS.8.EE.B.5
3.
HOTSPOT QUESTION
3 mins • 1 pt
Ross is buying hats for his baseball team. Each package contains 4 hats. Generate the set of ordered pairs for the ratio relationship between the number of hats y and the number of packages x for a total of 1, 2, 3, and 4 packages.
Select the points on the coordinate plane that correctly graph this ratio relationship.
Tags
graphing
4.
MULTIPLE CHOICE QUESTION
5 mins • 1 pt
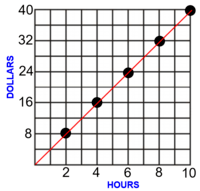
What is the ratio of the line graph shown?
4:1
2:1
3:2
8:1
Tags
CCSS.6.RP.A.1
CCSS.6.RP.A.2
5.
MULTIPLE CHOICE QUESTION
5 mins • 1 pt

Which rate of change represents the graph shown?
Tags
CCSS.7.RP.A.2D
6.
MULTIPLE CHOICE QUESTION
5 mins • 1 pt

How many ounces are there in 3 oranges?
9 ounces
10 ounces
12 ounces
15 ounces
Tags
CCSS.7.RP.A.2D
7.
MULTIPLE CHOICE QUESTION
5 mins • 1 pt

How much does 4 pounds cost?
$2
$3
$5
$9
Tags
CCSS.7.RP.A.2D


Access all questions and much more by creating a free account
Create resources
Host any resource
Get auto-graded reports
Continue with Google

Continue with Email
Continue with Classlink
Continue with Clever
or continue with
Microsoft
%20(1).png)
Apple
Others
Already have an account?
Similar Resources on Wayground
21 questions
Threes
Quiz
•
4th - 6th Grade
20 questions
ΠΡΟΠΑΙΔΕΙΑ
Quiz
•
2nd - 6th Grade
16 questions
Addition, Subtraction, Division, Multiplication
Quiz
•
KG - Professional Dev...
20 questions
ECUACIONES DE PRIMER GRADO
Quiz
•
1st - 10th Grade
20 questions
Decimals & Fractions
Quiz
•
6th - 8th Grade
15 questions
La divisibilità
Quiz
•
6th Grade
19 questions
Avaliação "Semana de Retomada 6°s Anos- Prof.a. Patrícia Barros
Quiz
•
6th Grade
19 questions
STAAR Equations, Expressions, and Inequalities
Quiz
•
6th Grade
Popular Resources on Wayground
7 questions
History of Valentine's Day
Interactive video
•
4th Grade
15 questions
Fractions on a Number Line
Quiz
•
3rd Grade
20 questions
Equivalent Fractions
Quiz
•
3rd Grade
25 questions
Multiplication Facts
Quiz
•
5th Grade
22 questions
fractions
Quiz
•
3rd Grade
15 questions
Valentine's Day Trivia
Quiz
•
3rd Grade
20 questions
Main Idea and Details
Quiz
•
5th Grade
20 questions
Context Clues
Quiz
•
6th Grade
Discover more resources for Mathematics
20 questions
Writing Algebraic Expressions
Quiz
•
6th Grade
20 questions
Ratios/Rates and Unit Rates
Quiz
•
6th Grade
20 questions
Graphing Inequalities on a Number Line
Quiz
•
6th - 9th Grade
20 questions
One Step Equations
Quiz
•
6th Grade
10 questions
Solving One Step Inequalities
Quiz
•
6th Grade
15 questions
Equivalent Ratios
Quiz
•
6th Grade
16 questions
2022 Winter Olympics Medal Table
Passage
•
6th - 8th Grade
20 questions
Writing Ratios & Identifying Equivalent Ratios
Quiz
•
6th Grade