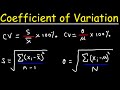
Understanding the Coefficient of Variation
Interactive Video
•
Mathematics, Science
•
9th - 12th Grade
•
Practice Problem
•
Hard

Aiden Montgomery
FREE Resource
Read more
10 questions
Show all answers
1.
MULTIPLE CHOICE QUESTION
30 sec • 1 pt
What is the coefficient of variation used to measure?
The product of mean and standard deviation
The sum of all data points
The ratio of standard deviation to mean
The absolute difference between data points
2.
MULTIPLE CHOICE QUESTION
30 sec • 1 pt
Why is the coefficient of variation considered unitless?
Because it is always expressed as a percentage
Because it is a ratio of two quantities with the same units
Because it is calculated using only whole numbers
Because it does not involve any mathematical operations
3.
MULTIPLE CHOICE QUESTION
30 sec • 1 pt
Why is the coefficient of variation useful in comparing different data sets?
It calculates the total sum of data points
It determines the highest value in the data set
It finds the average of all data points
It provides a unitless measure of variation
4.
MULTIPLE CHOICE QUESTION
30 sec • 1 pt
What is the first step in calculating the coefficient of variation?
Adding all data points together
Determining the range of the data set
Calculating the standard deviation
Finding the median of the data set
5.
MULTIPLE CHOICE QUESTION
30 sec • 1 pt
What is the formula for calculating the standard deviation of a sample?
Sum of data points divided by sample size
Square root of the sum of squared differences from the mean divided by n-1
Product of mean and standard deviation
Difference between the highest and lowest data points
6.
MULTIPLE CHOICE QUESTION
30 sec • 1 pt
In the example problem, what is the sample mean for Test A?
83.8
79.0
86.0
77.8
7.
MULTIPLE CHOICE QUESTION
30 sec • 1 pt
How is the standard deviation calculated in the example problem?
By subtracting the smallest data point from the largest
By dividing the sum of data points by the number of data points
By taking the square root of the sum of squared differences from the mean
By multiplying the mean by the number of data points
Access all questions and much more by creating a free account
Create resources
Host any resource
Get auto-graded reports
Continue with Google

Continue with Email
Continue with Classlink
Continue with Clever
or continue with
Microsoft
%20(1).png)
Apple
Others
Already have an account?
