- Resource Library
- Math
- Data And Graphing
- Data Representation
- Understanding Data Representation: Dot Plots And Histograms
Understanding Data Representation: Dot Plots and Histograms
Flashcard
•
Mathematics
•
6th - 10th Grade
•
Practice Problem
•
Hard

Wayground Content
FREE Resource
Student preview

15 questions
Show all answers
1.
FLASHCARD QUESTION
Front
What is a dot plot?
Back
A dot plot is a statistical chart that consists of dots representing the frequency of data points in a dataset, where each dot corresponds to one occurrence of a value.
2.
FLASHCARD QUESTION
Front
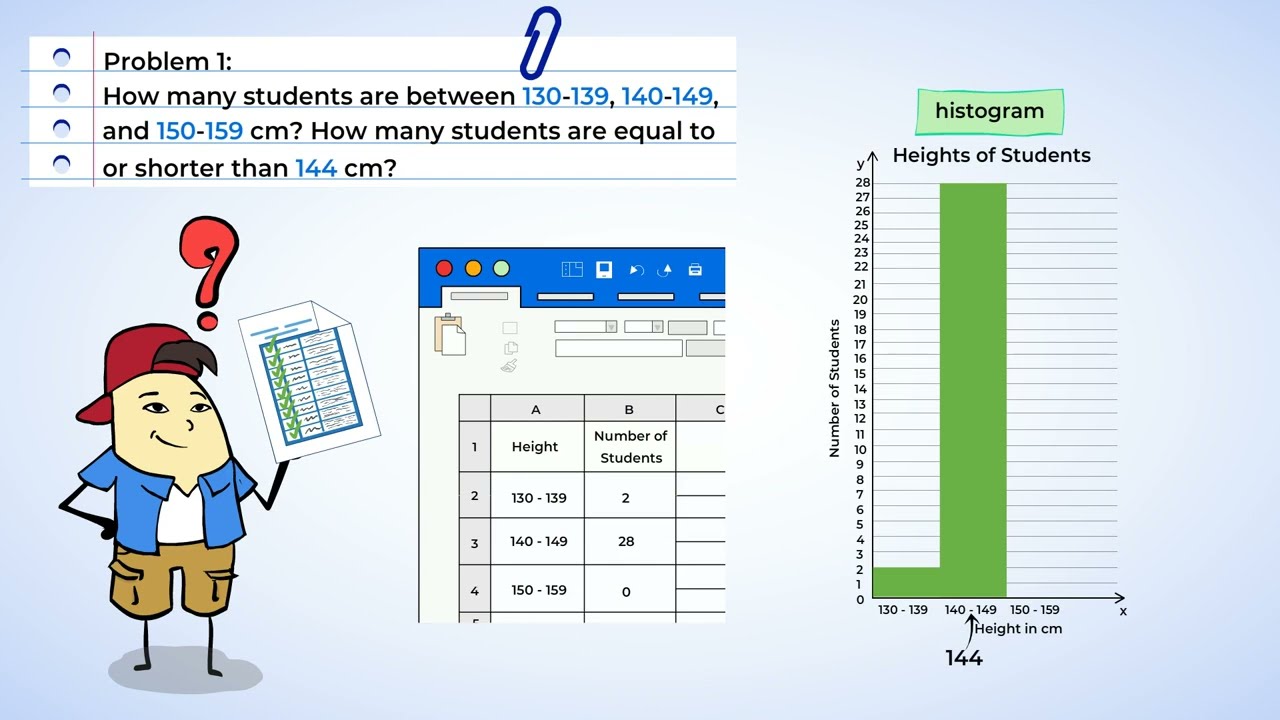
How is a histogram different from a dot plot?
Back
A histogram is a graphical representation of the distribution of numerical data, where data is grouped into bins or intervals, while a dot plot shows individual data points.
3.
FLASHCARD QUESTION
Front
What does the height of a bar in a histogram represent?
Back
The height of a bar in a histogram represents the frequency or count of data points that fall within the corresponding interval.
4.
FLASHCARD QUESTION
Front
What is the purpose of using graphs in data representation?
Back
Graphs are used to visualize data, making it easier to identify trends, patterns, and relationships within the data.
5.
FLASHCARD QUESTION
Front
How do you determine the mode from a dot plot?
Back
The mode is determined by identifying the value that appears most frequently in the dot plot.
6.
FLASHCARD QUESTION
Front
What is the significance of the x-axis in a histogram?
Back
The x-axis in a histogram represents the intervals or bins of the data, showing the range of values being analyzed.
7.
FLASHCARD QUESTION
Front
What does it mean for data to be grouped in intervals?
Back
Grouping data in intervals means organizing the data into ranges, allowing for easier analysis of frequency and distribution.
Access all questions and much more by creating a free account
Create resources
Host any resource
Get auto-graded reports
Continue with Google

Continue with Email
Continue with Classlink
Continue with Clever
or continue with
Microsoft
%20(1).png)
Apple
Others
Already have an account?
Similar Resources on Wayground

9 questions
Neoclassical Art
Flashcard
•
6th - 8th Grade
7 questions
Cell Division
Flashcard
•
6th - 8th Grade
15 questions
Flashcard review for TLE Quiz 1
Flashcard
•
6th - 8th Grade
10 questions
Aparato Respiratorio
Flashcard
•
KG
11 questions
Barreras del aprendizaje
Flashcard
•
KG
18 questions
8A REGLEMENTATION UDPS-83 EXAMEN BLANC FLASH
Flashcard
•
KG
14 questions
CADEIA ALIMENTAR
Flashcard
•
KG
16 questions
34.35.36. лекција
Flashcard
•
KG
Popular Resources on Wayground
15 questions
Fractions on a Number Line
Quiz
•
3rd Grade
20 questions
Equivalent Fractions
Quiz
•
3rd Grade
25 questions
Multiplication Facts
Quiz
•
5th Grade
29 questions
Alg. 1 Section 5.1 Coordinate Plane
Quiz
•
9th Grade
22 questions
fractions
Quiz
•
3rd Grade
11 questions
FOREST Effective communication
Lesson
•
KG
20 questions
Main Idea and Details
Quiz
•
5th Grade
20 questions
Context Clues
Quiz
•
6th Grade
Discover more resources for Mathematics
29 questions
Alg. 1 Section 5.1 Coordinate Plane
Quiz
•
9th Grade
36 questions
6th Grade Math STAAR Review
Quiz
•
6th Grade
14 questions
Volume of rectangular prisms
Quiz
•
7th Grade
14 questions
finding slope from a graph
Quiz
•
8th Grade
20 questions
Graphing Inequalities on a Number Line
Quiz
•
6th - 9th Grade
23 questions
Solve and Graph Inequalities
Quiz
•
6th Grade
15 questions
Distributive Property & Review
Quiz
•
6th Grade
10 questions
Mean, Median, Mode, and Range
Quiz
•
7th Grade