Decoding Climate Graphs: Interpretation and Insights
Interactive Video
•
Mathematics
•
1st - 5th Grade
•
Practice Problem
•
Hard
+4
Standards-aligned

Amelia Wright
Used 6+ times
FREE Resource
Standards-aligned
Read more
10 questions
Show all answers
1.
MULTIPLE CHOICE QUESTION
30 sec • 1 pt
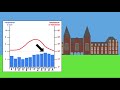
What does a climate graph typically show for a specific location?
Average temperature and precipitation over 30 years
Economic data and growth rates
Population density and migration patterns
Political stability and governance
2.
MULTIPLE CHOICE QUESTION
30 sec • 1 pt
What is the average temperature in Amsterdam during the winter months?
57 degrees Fahrenheit
63 degrees Fahrenheit
53 degrees Fahrenheit
35 degrees Fahrenheit
3.
MULTIPLE CHOICE QUESTION
30 sec • 1 pt
In which months does Amsterdam experience the highest average temperatures?
January and February
May and June
June, July, and August
September and October
4.
MULTIPLE CHOICE QUESTION
30 sec • 1 pt
Which month has the lowest average temperature in Amsterdam according to the climate graph?
December
September
May
January
5.
MULTIPLE CHOICE QUESTION
30 sec • 1 pt
How is precipitation shown on a climate graph?
As a scatter plot
Through a line graph
Using a pie chart
With a bar graph
6.
MULTIPLE CHOICE QUESTION
30 sec • 1 pt
What can the warm period in a climate graph indicate about a location's hemisphere?
Warm period in January suggests the northern hemisphere
Warm period in June suggests the southern hemisphere
No specific indication
Warm period in December suggests the southern hemisphere
Tags
CCSS.RI.1.7
CCSS.RI.2.7
CCSS.RI.4.7
CCSS.RI.5.7
CCSS.RL.1.7
7.
MULTIPLE CHOICE QUESTION
30 sec • 1 pt
What does low precipitation on a climate graph generally indicate about a location?
It is in a polar region
It is located near the equator
It is located further inland
It is located near the sea
Access all questions and much more by creating a free account
Create resources
Host any resource
Get auto-graded reports
Continue with Google

Continue with Email
Continue with Classlink
Continue with Clever
or continue with
Microsoft
%20(1).png)
Apple
Others
Already have an account?
Similar Resources on Wayground

2 questions
Kazakhstan's President Nursultan Nazarbaev meets Queen Elizabeth II at Buckingham Palace.
Interactive video
•
1st - 2nd Grade
6 questions
I WONDER - How Old Are Icebergs?
Interactive video
•
KG - 6th Grade
3 questions
Constructing Linear Functions from Graphs
Interactive video
•
1st - 6th Grade
2 questions
Multiplication: Solving Problems with Arrays
Interactive video
•
1st - 6th Grade
2 questions
Simplifying Expressions with Negative Terms
Interactive video
•
1st - 6th Grade
6 questions
Gravity - Why Things Fall
Interactive video
•
KG - 3rd Grade
2 questions
5 LITTLE SPECKLED FROGS | Classic Nursery Rhymes | English Songs For Kids | Nursery Rhymes TV
Interactive video
•
KG - 3rd Grade
Popular Resources on Wayground
15 questions
Fractions on a Number Line
Quiz
•
3rd Grade
20 questions
Equivalent Fractions
Quiz
•
3rd Grade
25 questions
Multiplication Facts
Quiz
•
5th Grade
54 questions
Analyzing Line Graphs & Tables
Quiz
•
4th Grade
22 questions
fractions
Quiz
•
3rd Grade
20 questions
Main Idea and Details
Quiz
•
5th Grade
20 questions
Context Clues
Quiz
•
6th Grade
15 questions
Equivalent Fractions
Quiz
•
4th Grade
Discover more resources for Mathematics
15 questions
Fractions on a Number Line
Quiz
•
3rd Grade
20 questions
Equivalent Fractions
Quiz
•
3rd Grade
25 questions
Multiplication Facts
Quiz
•
5th Grade
54 questions
Analyzing Line Graphs & Tables
Quiz
•
4th Grade
22 questions
fractions
Quiz
•
3rd Grade
15 questions
Equivalent Fractions
Quiz
•
4th Grade
18 questions
Comparing Fractions with same numerator or denominator
Quiz
•
3rd Grade
16 questions
Interpreting Line Graphs & Double Tables
Quiz
•
4th Grade