Exploring Graphing Functions in Algebra
Interactive Video
•
Mathematics
•
8th - 12th Grade
•
Practice Problem
•
Hard
+3
Standards-aligned

Amelia Wright
FREE Resource
Standards-aligned
Read more
10 questions
Show all answers
1.
MULTIPLE CHOICE QUESTION
30 sec • 1 pt
What is the approximate rate at which sea level is rising per year?
4.5 millimeters
2.5 millimeters
1.5 millimeters
3.5 millimeters
2.
MULTIPLE CHOICE QUESTION
30 sec • 1 pt
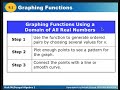
What is the first step in graphing a function given a limited domain?
Find the range
Solve for y using given x values
Draw the graph
Identify the function type
Tags
CCSS.8.F.A.1
CCSS.HSF.IF.B.5
3.
MULTIPLE CHOICE QUESTION
30 sec • 1 pt
When graphing a function with a limited domain, should you connect the dots?
No, never
Only if the function is continuous
Yes, always
Only if the domain is discrete
Tags
CCSS.8.F.A.1
CCSS.HSF.IF.B.5
4.
MULTIPLE CHOICE QUESTION
30 sec • 1 pt
How many points are needed to graph a linear function?
Four
Two
Three
One
5.
MULTIPLE CHOICE QUESTION
30 sec • 1 pt
What does the absolute value function do to the input values?
Makes them positive
Squares them
Makes them negative
Divides them by two
Tags
CCSS.HSF-IF.C.7D
6.
MULTIPLE CHOICE QUESTION
30 sec • 1 pt
How can you check if your graph is correct?
By re-drawing the graph
By plotting an additional point
By comparing with a friend's graph
By using a calculator
Tags
CCSS.HSF-IF.C.7E
7.
MULTIPLE CHOICE QUESTION
30 sec • 1 pt
In real-world situations, why might you need to limit the domain?
To avoid negative values
To make calculations easier
To use fewer points
To simplify the graph
Tags
CCSS.HSF-BF.B.4D
Access all questions and much more by creating a free account
Create resources
Host any resource
Get auto-graded reports
Continue with Google

Continue with Email
Continue with Classlink
Continue with Clever
or continue with
Microsoft
%20(1).png)
Apple
Others
Already have an account?
Popular Resources on Wayground

15 questions
Fractions on a Number Line
Quiz
•
3rd Grade
20 questions
Equivalent Fractions
Quiz
•
3rd Grade
25 questions
Multiplication Facts
Quiz
•
5th Grade
54 questions
Analyzing Line Graphs & Tables
Quiz
•
4th Grade
22 questions
fractions
Quiz
•
3rd Grade
20 questions
Main Idea and Details
Quiz
•
5th Grade
20 questions
Context Clues
Quiz
•
6th Grade
15 questions
Equivalent Fractions
Quiz
•
4th Grade
Discover more resources for Mathematics
14 questions
finding slope from a graph
Quiz
•
8th Grade
20 questions
Laws of Exponents
Quiz
•
8th Grade
12 questions
8th U5L9 Linear Models
Quiz
•
8th Grade
20 questions
Graphing Inequalities on a Number Line
Quiz
•
6th - 9th Grade
18 questions
SAT Prep: Ratios, Proportions, & Percents
Quiz
•
9th - 10th Grade
20 questions
Volume of cylinders, Cones and Spheres
Quiz
•
8th Grade
12 questions
Exponential Growth and Decay
Quiz
•
9th Grade
20 questions
One Step equations addition and subtraction
Quiz
•
5th - 8th Grade